The working capital turnover ratio measures how much sales revenue a company generates for each rupee of average working capital. We calculate it by dividing net sales by average working capital for the same period. When we read a company’s results, revenue growth is only part of the picture. We also need to understand how…
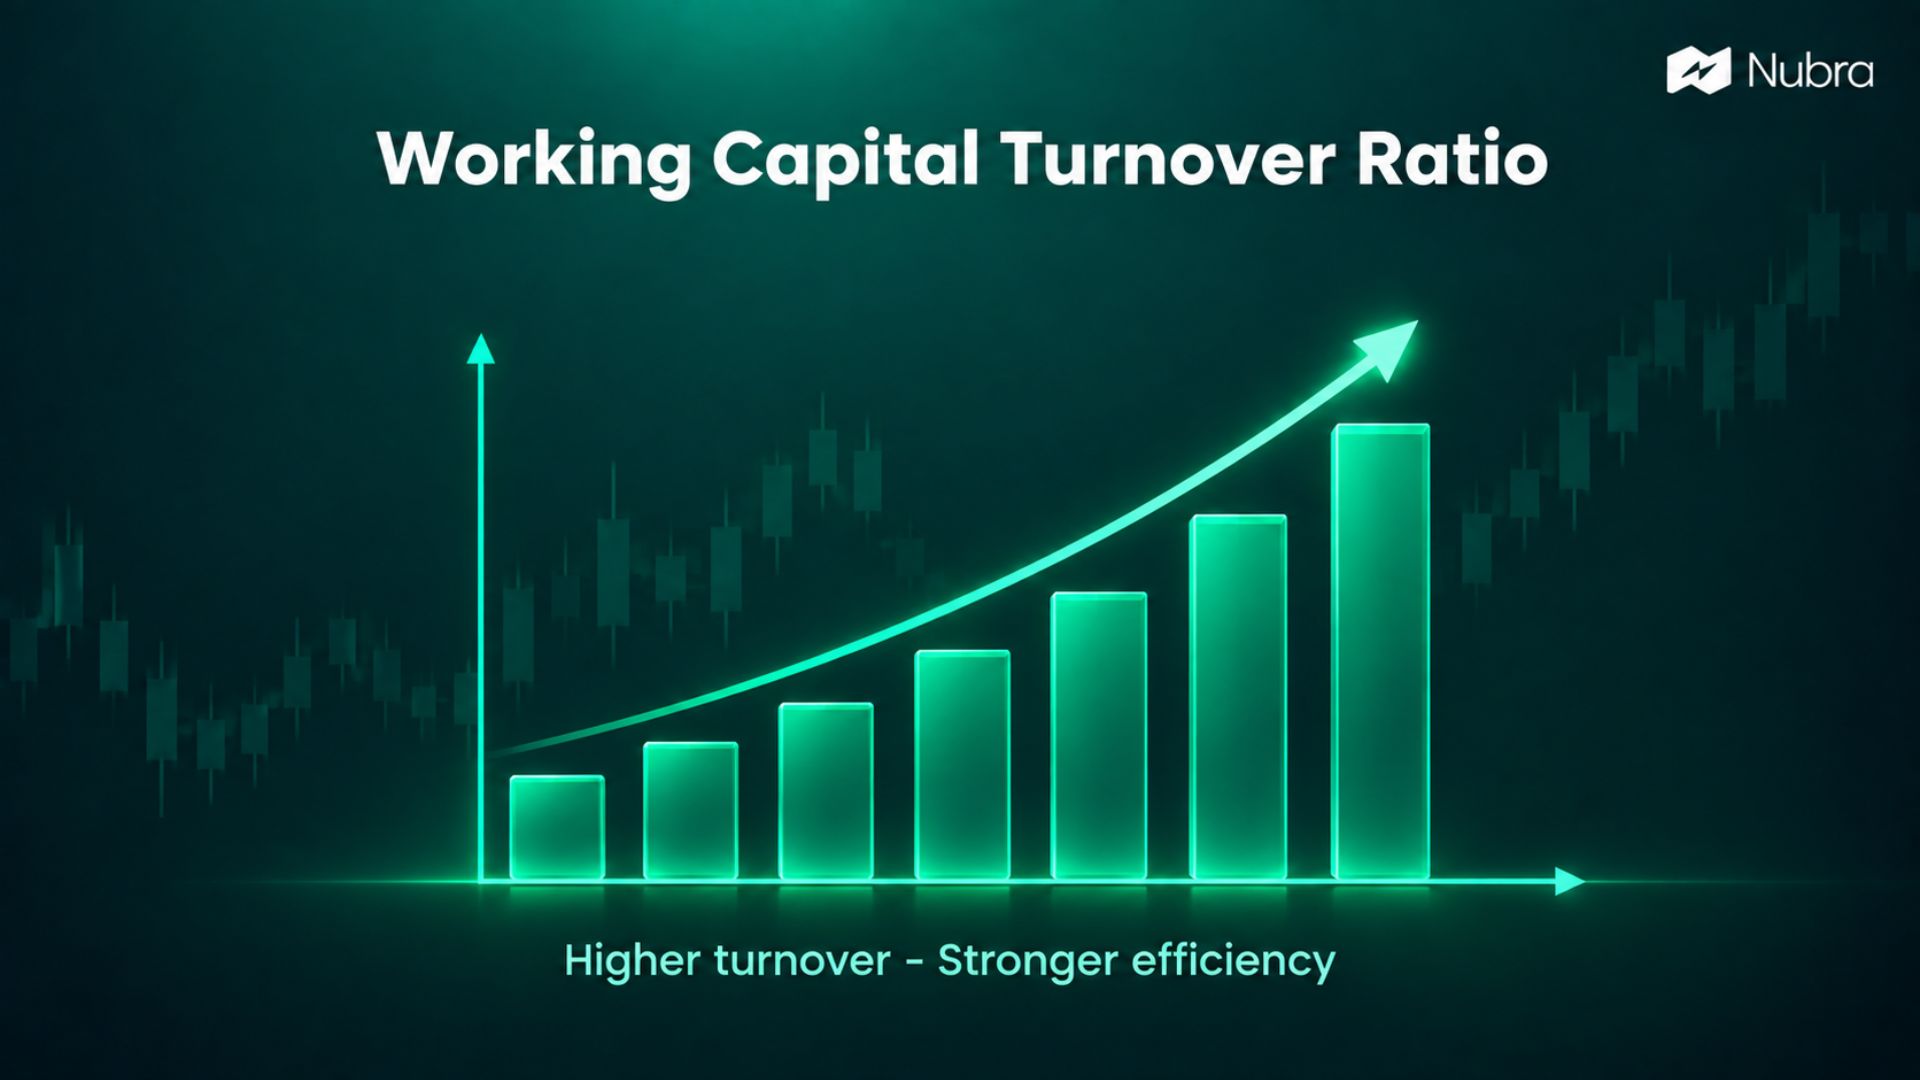
The working capital turnover ratio measures how much sales revenue a company generates for each rupee of average working capital. We calculate it by dividing net sales by average working capital for the same period.
When we read a company’s results, revenue growth is only part of the picture. We also need to understand how much money supports those sales. This ratio helps us examine that relationship, although it cannot tell us whether a stock’s price will rise or fall.
Working Capital Turnover Ratio Formula
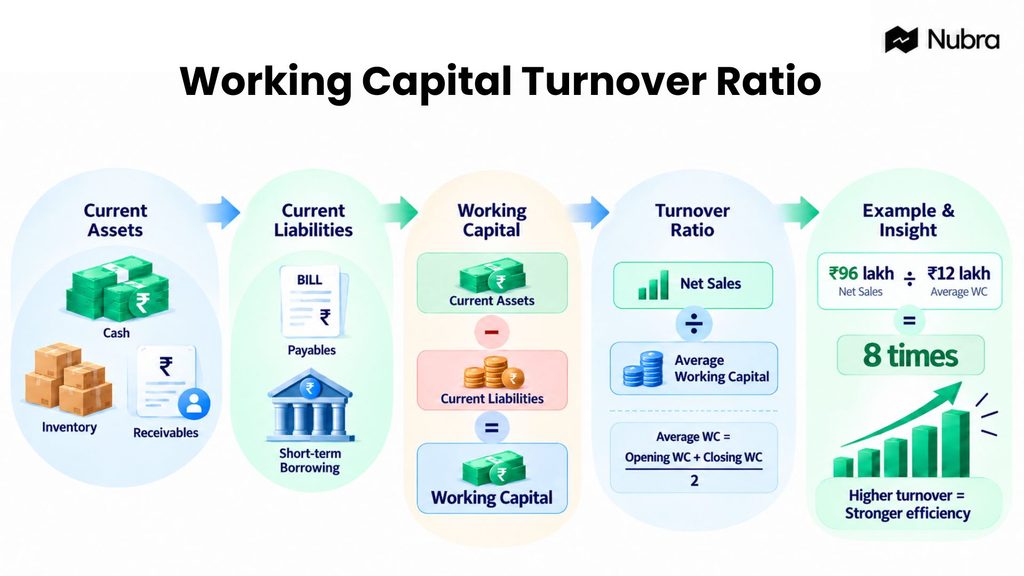
Working capital turnover ratio = Net sales ÷ Average working capital
We calculate the denominator in two steps:
Working capital = Current assets − Current liabilities
Average working capital = (Opening working capital + Closing working capital) ÷ 2
Current assets include cash, inventory and money customers owe the business. Current liabilities include amounts owed to suppliers and short-term borrowings. Working capital is the difference between these totals; it is not simply cash in the bank.
Net sales means sales after returns, allowances and discounts. We use the income statement for sales and the balance sheet for current assets and liabilities. For an annual calculation, both inputs should cover the same financial year.
How We Calculate It: A Rupee-Based Example
Let’s work through a hypothetical manufacturer with annual net sales of ₹96 lakh.
- Opening current assets are ₹30 lakh and current liabilities are ₹20 lakh. Opening working capital is ₹10 lakh.
- Closing current assets are ₹38 lakh and current liabilities are ₹24 lakh. Closing working capital is ₹14 lakh.
- Average working capital is (₹10 lakh + ₹14 lakh) ÷ 2 = ₹12 lakh.
- Working capital turnover is ₹96 lakh ÷ ₹12 lakh = 8 times.
The company generated ₹8 in net sales for each ₹1 of average working capital during the year. That is sales, not profit or cash collected.
Using only the closing balance would give us about 6.86 times. The difference shows why we should check the calculation method before comparing published ratios.
How We Interpret a High or Low Ratio
When The Ratio is High
A higher positive ratio can indicate that a business supports more sales with less working capital. Efficient stock management and timely customer payments may help explain it.
However, we need to examine why the number increased. Suppose our manufacturer’s average working capital falls to ₹6 lakh while sales remain ₹96 lakh. Turnover doubles to 16 times, even though sales have not grown.
If the fall reflects rising unpaid supplier bills, the higher ratio may accompany cash pressure. We should check payment terms and overdue balances before treating it as an improvement.
When The Ratio is Low
A lower ratio means less revenue relative to the working capital employed. It may reflect slow sales, unsold stock or delayed customer payments.
Context can change the interpretation. A business might build inventory before its busiest season, temporarily increasing working capital. We can read the inventory notes and management commentary to distinguish planned preparation from stock that is becoming difficult to sell.
What Makes the Comparison Useful?
There is no single working capital turnover ratio that is good for every business. We get more useful comparisons by checking similar companies and the same company over several periods.
Three details deserve attention:
- Seasonality: Opening and closing balances can miss large changes within the year. Where data is available, monthly or quarterly balances can give us a more representative average.
- Consistent definitions: Some analyses use operating working capital, excluding items such as cash and borrowings. We should avoid comparing that calculation directly with one using all current assets and liabilities.
- Very small balances: A denominator close to zero can produce an unusually large ratio. If average working capital is zero, the ratio is undefined. A negative denominator also prevents a straightforward high-versus-low comparison.
These checks help us avoid mistaking a change in accounting inputs for a change in business performance.
Using The Ratio in Company Analysis
For our analysis, the next step is to connect turnover with cash flow. Sales can be recorded before customers pay, so a strong turnover figure does not establish that cash is arriving on time.
We can study the receivable turnover ratio to understand collections, then examine inventory movement and cash flow from operations. Together, these help us investigate what sits behind the headline number.
When a company reports better working capital turnover, we can check whether it has reduced slow-moving stock, collected payments sooner or increased sales without a similar rise in working capital. Delaying supplier payments beyond agreed terms may lift the ratio while creating other problems.
For traders reviewing results, this is company-level context. We still need to assess the market setup and risk separately; the ratio does not identify a trade entry or predict short-term price moves. We can continue building that broader understanding through our Nubra educational guides.
FAQs
Is a Working Capital Turnover Ratio of 8 Good?
We cannot judge 8 times on its own. It means ₹8 of sales per ₹1 of average working capital. The company’s history, comparable peers and cash position determine how we interpret it.
What Does a Negative Working Capital Turnover Ratio Mean?
With positive net sales, it means average working capital is negative. We need to examine the business’s payment cycle and liquidity instead of ranking the negative result against positive ratios.
Is Working Capital Turnover the Same as the Current Ratio?
No. Working capital turnover compares sales with average working capital to examine efficiency. The current ratio divides current assets by current liabilities to assess short-term asset coverage. We use them to answer different questions.
Disclaimer: The information provided in this blog is for educational and informational purposes only and should not be construed as investment advice, financial advice, or a recommendation to buy, sell, or hold any securities or financial products. Investments in the securities market are subject to market risks. Please read all related documents carefully before investing. Readers should conduct their own research and consult a SEBI-registered investment adviser or other qualified financial professional before making any investment decisions. Past performance is not indicative of future results.