The receivable turnover ratio shows how efficiently a company collects money from customers who bought goods or services on credit. It tells us how many times, during a period, the company converts its average accounts receivable into cash. For traders and investors, this ratio is useful because sales growth does not always mean strong cash…
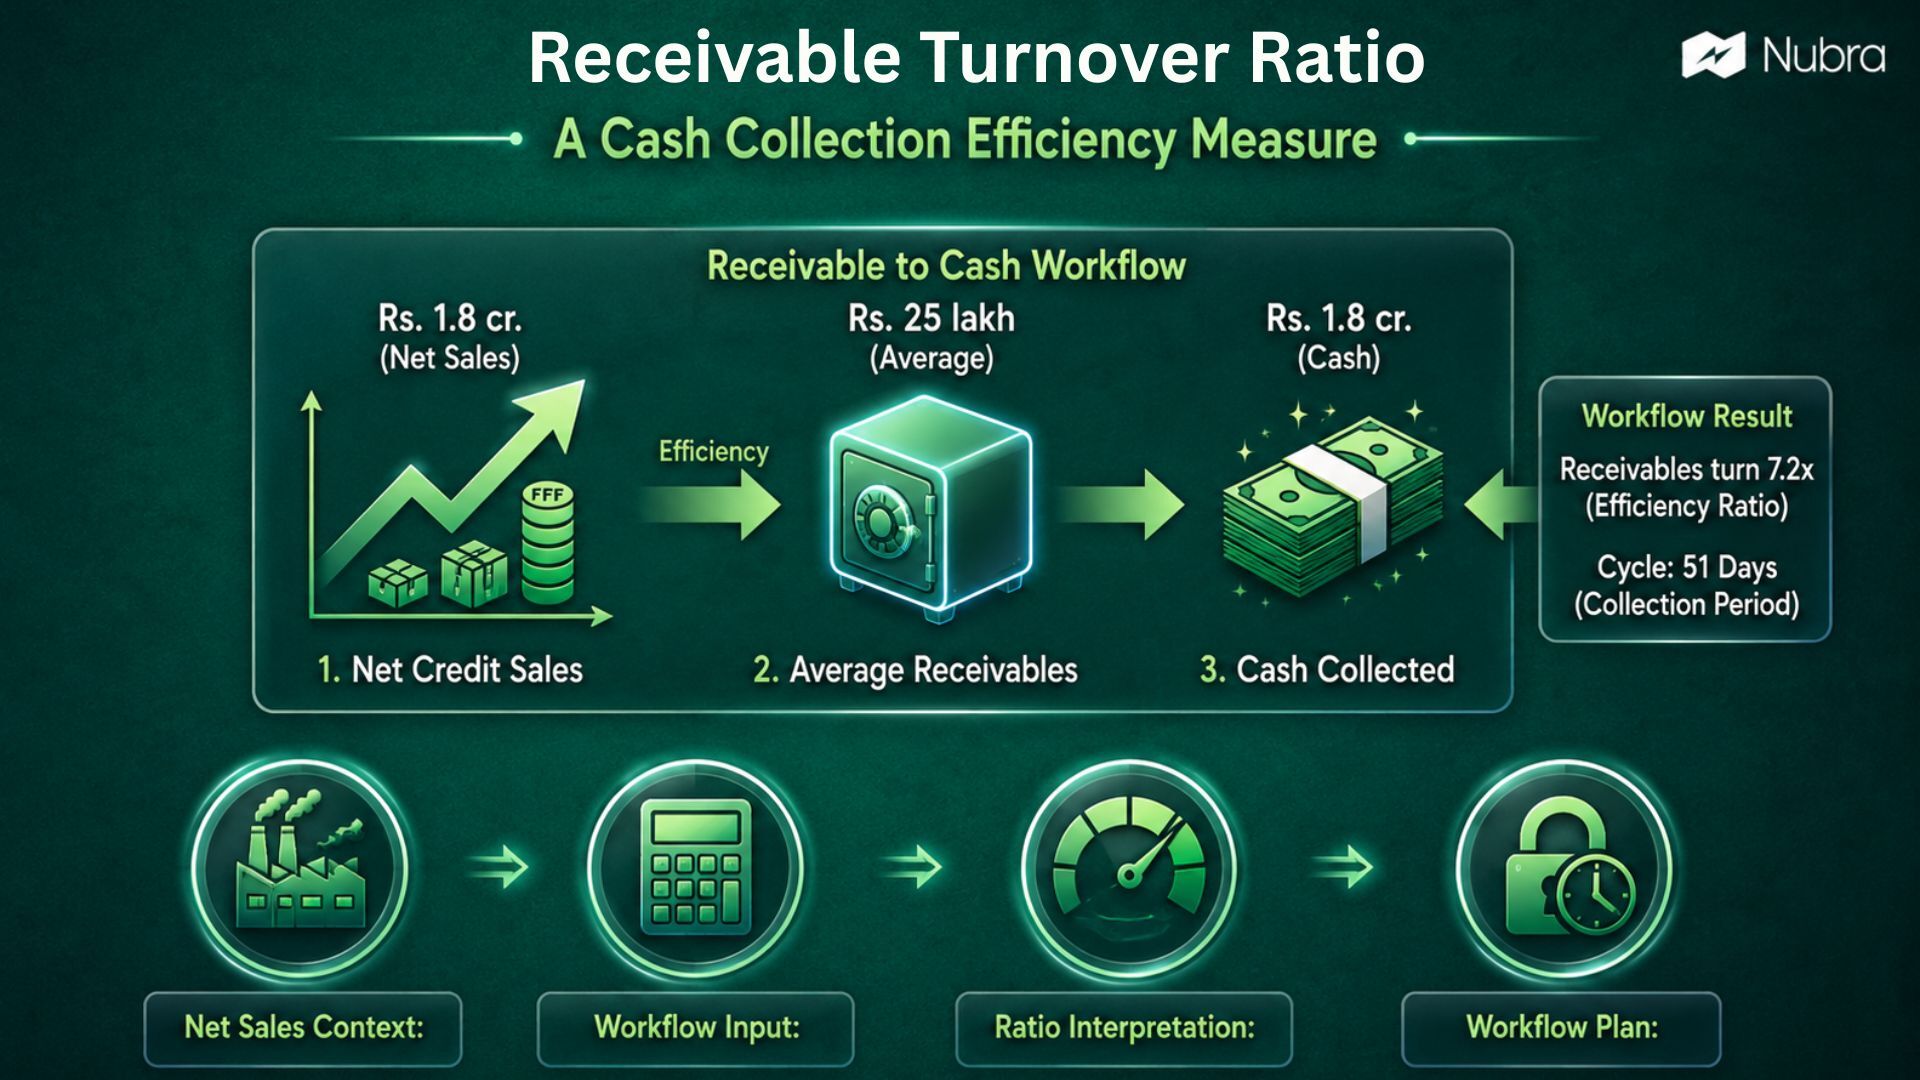
The receivable turnover ratio shows how efficiently a company collects money from customers who bought goods or services on credit. It tells us how many times, during a period, the company converts its average accounts receivable into cash.
For traders and investors, this ratio is useful because sales growth does not always mean strong cash collection. A company may report revenue, but if customers take too long to pay, cash can remain stuck in receivables. That can affect working capital, borrowing needs, and the quality of reported earnings.
The ratio is simple, but it should not be read in isolation. We get a clearer picture when we compare it with the company’s past trend, peer companies, payment terms, cash flow, and industry context.
What Is the Receivable Turnover Ratio?
The receivable turnover ratio, also called the accounts receivable turnover ratio or debtor turnover ratio, is an efficiency ratio. It measures how often a business collects its average receivables over a specific period.
Accounts receivable is the money customers owe to a company for credit sales. If a company sells goods worth ₹10 lakh today and allows the customer to pay later, that unpaid amount appears as receivables until it is collected.
The receivable turnover ratio answers a direct question: how quickly is the company turning credit sales into cash?
A higher ratio usually means the company is collecting payments faster. A lower ratio usually means collections are slower, credit terms may be loose, or customers may be taking longer to pay. But the word “usually” matters. Some businesses naturally have longer payment cycles, while others operate mostly on cash or short credit terms.
Receivable Turnover Ratio Formula
The formula is:
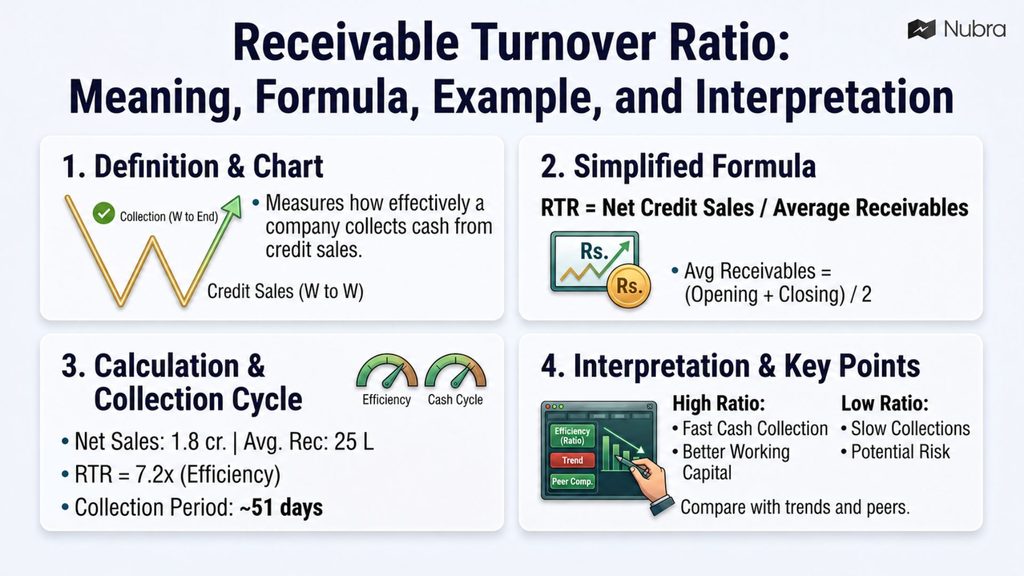
Receivable Turnover Ratio = Net Credit Sales / Average Accounts Receivable
There are two main inputs:
| Component | Meaning |
| Net credit sales | Credit sales after deducting returns, discounts, or allowances |
| Average accounts receivable | The average receivable balance during the period |
Average accounts receivable is usually calculated as:
Average Accounts Receivable = (Opening Accounts Receivable + Closing Accounts Receivable) / 2
If a company’s receivables were ₹20 lakh at the start of the year and ₹30 lakh at the end, average accounts receivable would be:
(₹20 lakh + ₹30 lakh) / 2 = ₹25 lakh
The same period should be used for both sales and receivables. If we are calculating the annual ratio, we should use annual net credit sales and the average receivables for that year.
How to Calculate Receivable Turnover Ratio
To calculate the ratio, we can follow a simple flow.
First, identify the company’s net credit sales for the period. If only total sales are available, the ratio may become less precise because cash sales are not the same as credit sales.
Second, calculate average accounts receivable by adding the opening and closing receivable balances and dividing by two.
Third, divide net credit sales by average accounts receivable.
For example, suppose a company has:
| Item | Amount |
| Gross credit sales | ₹2 crore |
| Sales returns and allowances | ₹20 lakh |
| Opening accounts receivable | ₹30 lakh |
| Closing accounts receivable | ₹20 lakh |
Net credit sales would be:
₹2 crore – ₹20 lakh = ₹1.8 crore
Average accounts receivable would be:
(₹30 lakh + ₹20 lakh) / 2 = ₹25 lakh
Receivable turnover ratio would be:
₹1.8 crore / ₹25 lakh = 7.2 times
This means the company collected its average receivables about 7.2 times during the year.
Receivable Turnover Ratio in Days
The ratio can also be converted into the average collection period. This makes the number easier to interpret because we can read it in days.
Receivable Turnover in Days = 365 / Receivable Turnover Ratio
Using the example above:
365 / 7.2 = 50.7 days
So, the company takes about 51 days on average to collect money from customers.
This is where the ratio becomes more practical. If the company’s normal credit policy is 30 days but collections take 51 days, we may need to ask why customers are paying late. If the credit policy is 60 days, a 51-day collection period may look reasonable.
How to Interpret a High Receivable Turnover Ratio
A high receivable turnover ratio generally means the company collects money from customers quickly. This can point to disciplined credit control, strong customer quality, efficient follow-up, or a business model where customers pay quickly.
For investors and analysts, a consistently high ratio can support the view that reported sales are converting into cash efficiently. It can also indicate that less money is tied up in receivables, which may support working capital health.
However, a very high ratio is not automatically positive. It may also mean the company has very strict credit terms. Strict terms can protect cash flow, but they may also limit sales if customers prefer competitors with more flexible payment options. A company that collects fast but loses customers may not be improving its business quality.
That is why we should compare the ratio with revenue growth, customer concentration, industry practices, and the company’s own history.
How to Interpret a Low Receivable Turnover Ratio
A low receivable turnover ratio usually means the company takes longer to collect payments. This may happen because customers are delaying payments, the company has relaxed credit terms, the collection process is weak, or sales are being pushed aggressively on credit.
For traders reading quarterly results, a sudden fall in receivable turnover can be worth attention. If revenue is rising but receivables are rising faster, cash conversion may be weakening. This does not automatically mean the company is in trouble, but it can be a signal to check operating cash flow, receivable ageing, bad-debt provisions, and management commentary.
Low turnover can also be normal in some industries. Businesses that sell to large enterprises, government buyers, infrastructure clients, or long-cycle projects may naturally collect later than retail businesses. The useful question is not simply whether the number is high or low. The better question is whether the ratio makes sense for that industry and whether it is improving or deteriorating.
What Is a Good Receivable Turnover Ratio?
There is no single good receivable turnover ratio for every company. A good number depends on the industry, business model, customer base, credit terms, and accounting period.
For example, a company that sells mostly in cash may show a very high turnover ratio because receivables are low. A B2B supplier with 60-day payment terms may show a lower ratio without necessarily having poor collections. A project-based business may have uneven receivables because billing and payment milestones do not happen evenly through the year.
We usually get better insight by checking:
| Comparison | What it tells us |
| Same company over time | Whether collection efficiency is improving or weakening |
| Peer companies | Whether the ratio is normal for the industry |
| Credit policy | Whether customers are paying within agreed terms |
| Operating cash flow | Whether reported sales are converting into cash |
| Receivable ageing | Whether older unpaid balances are building up |
If a company has a ratio of 8 times, we should not call it good or bad without context. If peers average 5 times, it may look strong. If peers average 12 times, it may look weak. If the same company was at 11 times last year and is now at 8 times, the trend may matter more than the absolute number.
Why Receivable Turnover Ratio Matters for Traders and Investors
Receivable turnover ratio helps us look beyond headline revenue. This is especially useful when we are analysing companies where working capital plays a large role, such as manufacturing, distribution, infrastructure, capital goods, B2B services, and some export-led businesses.
When receivables are collected on time, cash can return to the business faster. That cash can be used for inventory, salaries, debt repayment, expansion, or dividends. When receivables remain unpaid for too long, the company may need more borrowing or may face pressure on day-to-day liquidity.
Use receivable turnover alongside revenue growth, margins, debt and operating cash flow when reviewing a company’s financial statements. Nubra Charts can then help examine its price action. For an options trade in an eligible stock, select the relevant underlying and expiry in Nubra Option Chain to inspect strike-level data, and use Nubra Strategy Builder to compare payoff scenarios. Keep the financial-statement review as the source for the ratio; the trading tools support subsequent market and strategy analysis.
The ratio can also help us notice quality-of-earnings concerns. If profit rises but cash flow weakens and receivables expand sharply, the result deserves a closer read. The issue may be seasonal, industry-wide, or temporary. But it may also reflect stretched customer payments or aggressive credit sales.
Limitations of Receivable Turnover Ratio
The receivable turnover ratio is useful, but it has limits.
First, it depends on the quality of inputs. Net credit sales may not always be disclosed clearly. If we use total sales instead of credit sales, the ratio may be distorted, especially for companies with a large cash-sales component.
Second, the ratio can be affected by seasonality. A company may have unusually high receivables at year-end because of a strong final quarter. In such cases, using only opening and closing balances may not capture the true average for the year.
Third, the ratio does not show receivable ageing. Two companies may have the same turnover ratio, but one may have fresh receivables while the other carries old overdue balances. Ageing schedules, bad-debt provisions, and write-offs can add important context.
Fourth, a high ratio can reflect strict credit terms rather than superior business strength. A low ratio can reflect industry structure rather than poor management. The number needs interpretation, not mechanical judgement.
For traders and investors, the common trap is to treat a single ratio as a final answer. We should use it as a question generator: why did it change, how does it compare with peers, and does cash flow confirm the story?
How Improvements in Receivable Turnover Can Be Read
When a company improves receivable turnover, it may be tightening credit checks, setting clearer payment terms, invoicing on time, following up more consistently, resolving billing disputes faster, or monitoring overdue balances more closely.
For investors, the useful point is not just that collections improved. The useful point is whether the company is balancing sales growth with healthy cash conversion. If receivable turnover improves while revenue remains stable or grows, it may indicate better working-capital discipline.
We should also be careful when the ratio improves too sharply. It may mean the company is genuinely collecting better, or it may mean credit sales have slowed in a way that affects growth. The business outcome matters more than the ratio alone.
Receivable Turnover Ratio vs Average Collection Period
Receivable turnover ratio and average collection period use the same underlying idea, but they express it differently.
| Metric | Formula | Interpretation |
| Receivable turnover ratio | Net credit sales / Average accounts receivable | How many times receivables are collected in a period |
| Average collection period | 365 / Receivable turnover ratio | Average number of days taken to collect receivables |
The turnover ratio is useful for comparing efficiency. The collection period is useful for matching collections against credit terms. If a company offers 45-day credit and collects in 48 days, the gap may be manageable. If it collects in 90 days, the working-capital pressure may be more serious.
FAQs
What does receivable turnover ratio mean?
Receivable turnover ratio measures how many times a company collects its average accounts receivable during a period. It shows how efficiently credit sales are converted into cash.
What is the formula for receivable turnover ratio?
The formula is net credit sales divided by average accounts receivable. Average accounts receivable is usually calculated by adding opening and closing receivables and dividing by two.
Is a higher receivable turnover ratio always better?
Not always. A higher ratio usually indicates faster collections, but it can also reflect very strict credit terms. We should compare the ratio with industry norms, revenue growth, and the company’s credit policy.
What does a low receivable turnover ratio indicate?
A low ratio may indicate slow collections, loose credit terms, weak customer quality, or delayed payments. It should be checked with operating cash flow, receivable ageing, and peer comparisons.
How do you calculate receivable turnover in days?
Receivable turnover in days is calculated as 365 divided by the receivable turnover ratio. It shows the average number of days the company takes to collect receivables.
Can traders use receivable turnover ratio for stock analysis?
Yes, traders and investors can use it as part of fundamental analysis. It can help assess cash conversion and working-capital quality, but it should not be treated as a buy or sell signal.
Why does receivable turnover ratio matter for cash flow?
When customers pay faster, cash returns to the business sooner. When receivables stay unpaid for longer, more cash remains tied up, which can increase working-capital pressure.
Is receivable turnover ratio the same as debtor turnover ratio?
Yes, receivable turnover ratio and debtor turnover ratio are commonly used for the same concept: how efficiently a company collects money owed by customers.
Disclaimer: The information provided in this blog is for educational and informational purposes only and should not be construed as investment advice, financial advice, or a recommendation to buy, sell, or hold any securities or financial products. Investments in the securities market are subject to market risks. Please read all related documents carefully before investing. Readers should conduct their own research and consult a SEBI-registered investment adviser or other qualified financial professional before making any investment decisions. Past performance is not indicative of future results.