Nubra Blogs

The Ultimate Guide to Options Trading

Average True Range

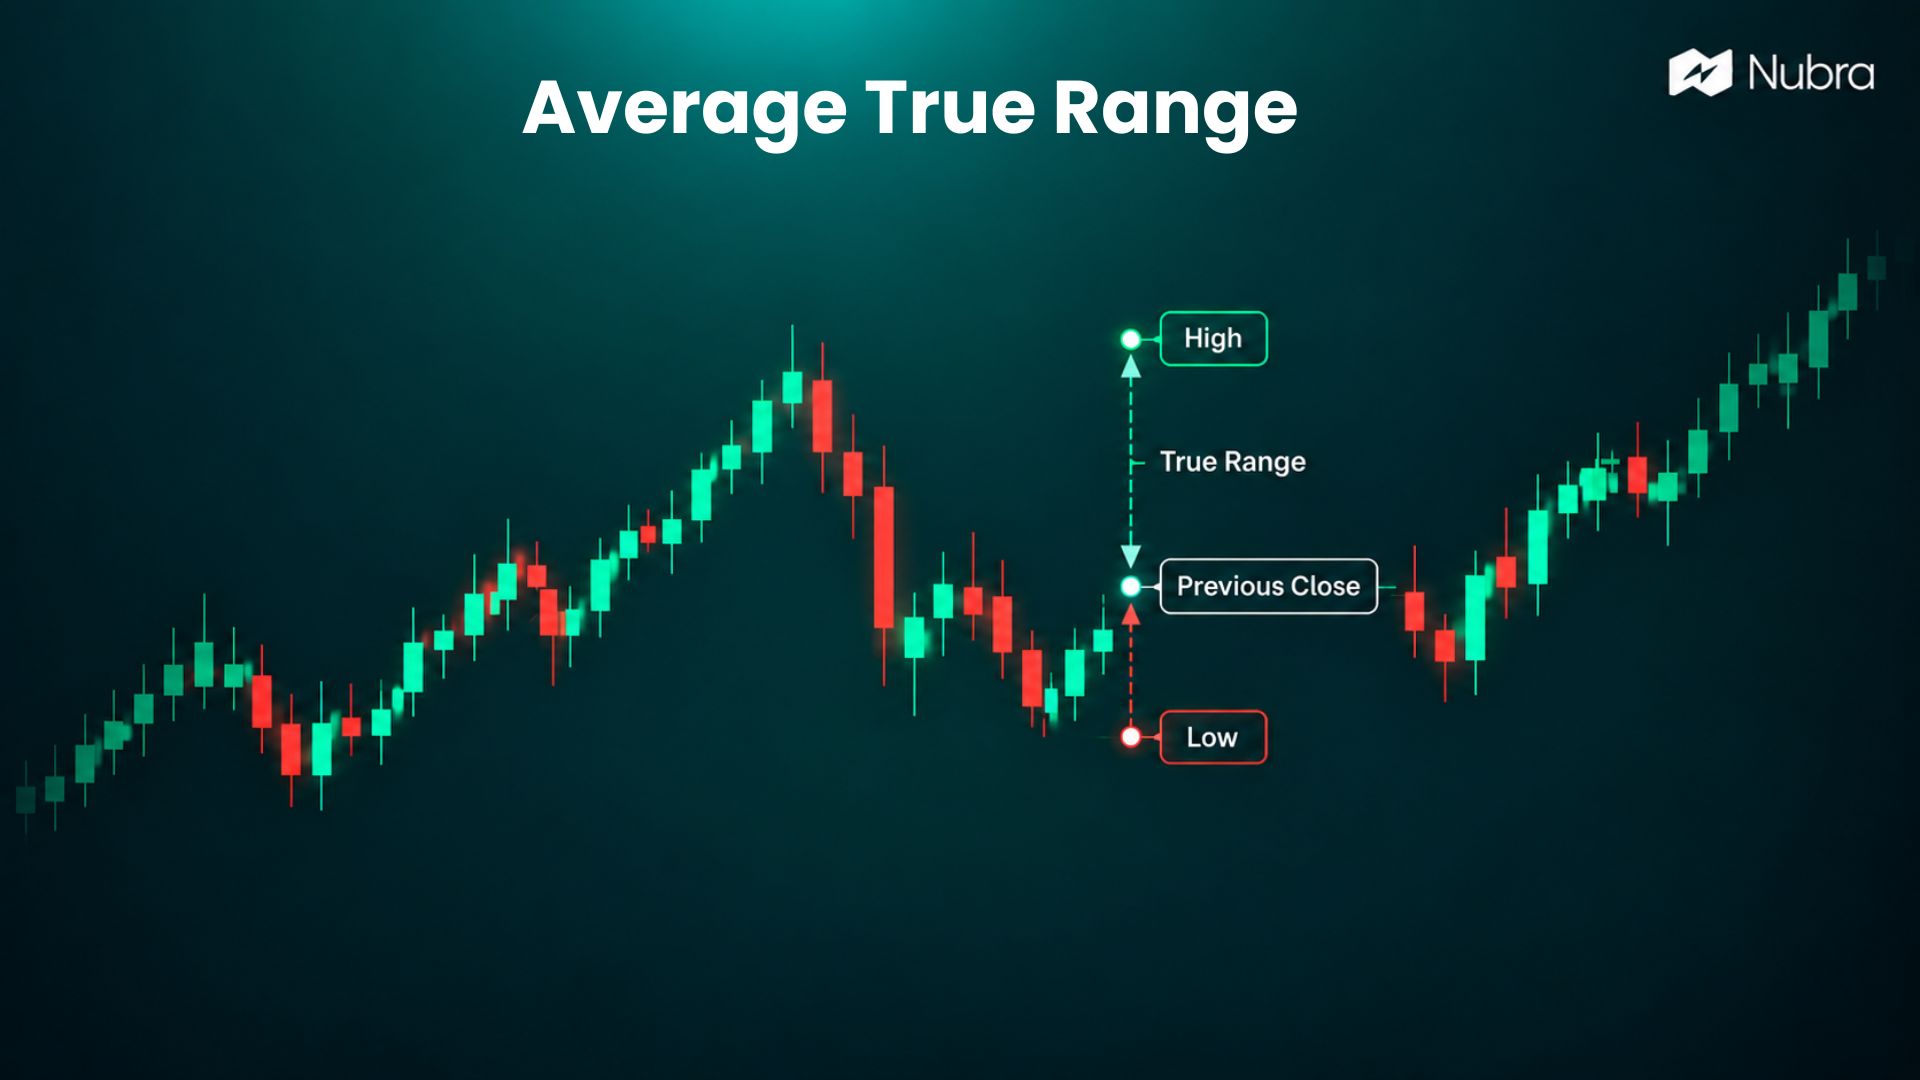
Average True Range (ATR): Formula, Calculation and Uses

A ₹10 move can look dramatic on one stock and ordinary on another. Before we judge the move, we need to understand how widely that stock’s price has been moving. Average True Range, or ATR, helps us put that movement in context. ATR measures price volatility by averaging the true range over a chosen number…

Sep 15, 2026
Read more
Risk Reward Ratio

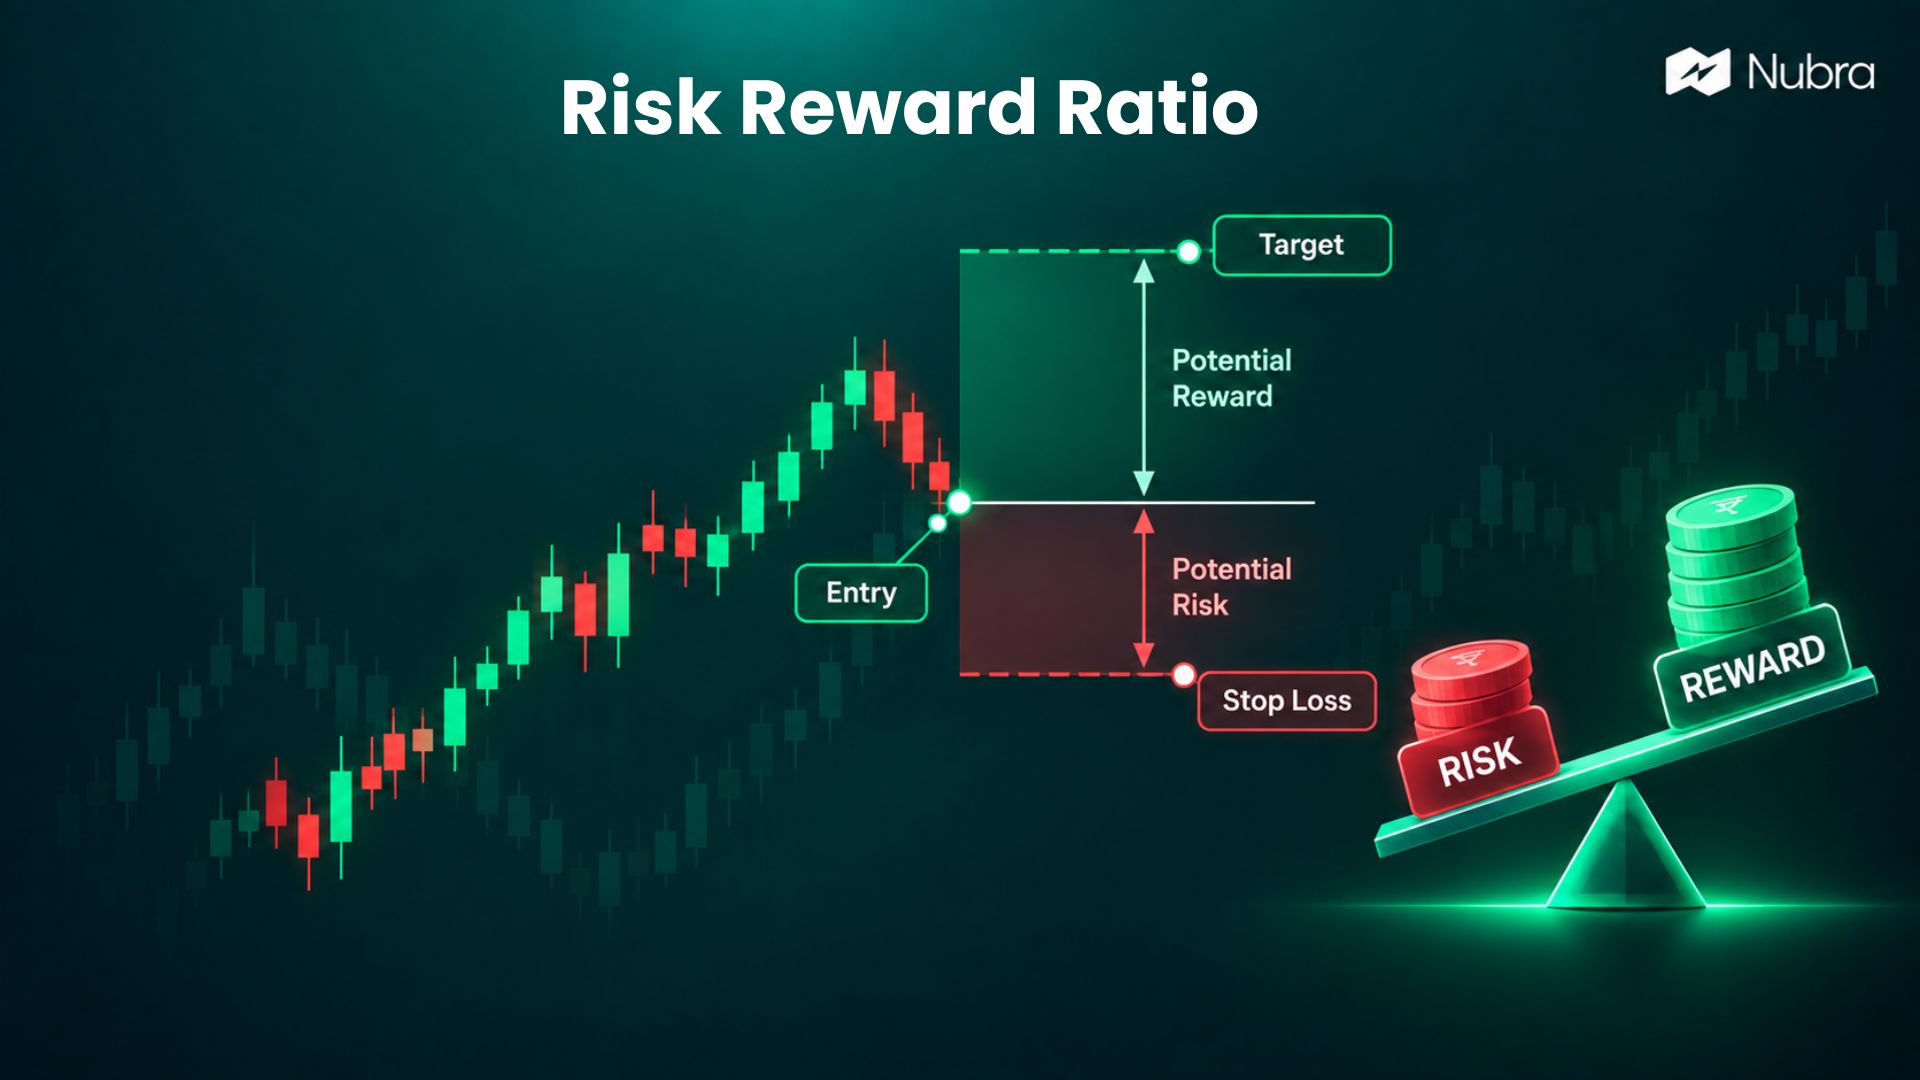
Understanding the Risk/Reward Ratio

Before we enter a trade, it helps to put two numbers side by side: the loss we are planning for and the profit we are targeting. The risk/reward ratio compares those amounts. If our planned loss is ₹500 and our potential profit is ₹1,000, the risk:reward ratio is 1:2. We are risking one rupee for…

Falling Wedge Pattern

Falling Wedge Pattern: Meaning, Features and Breakouts

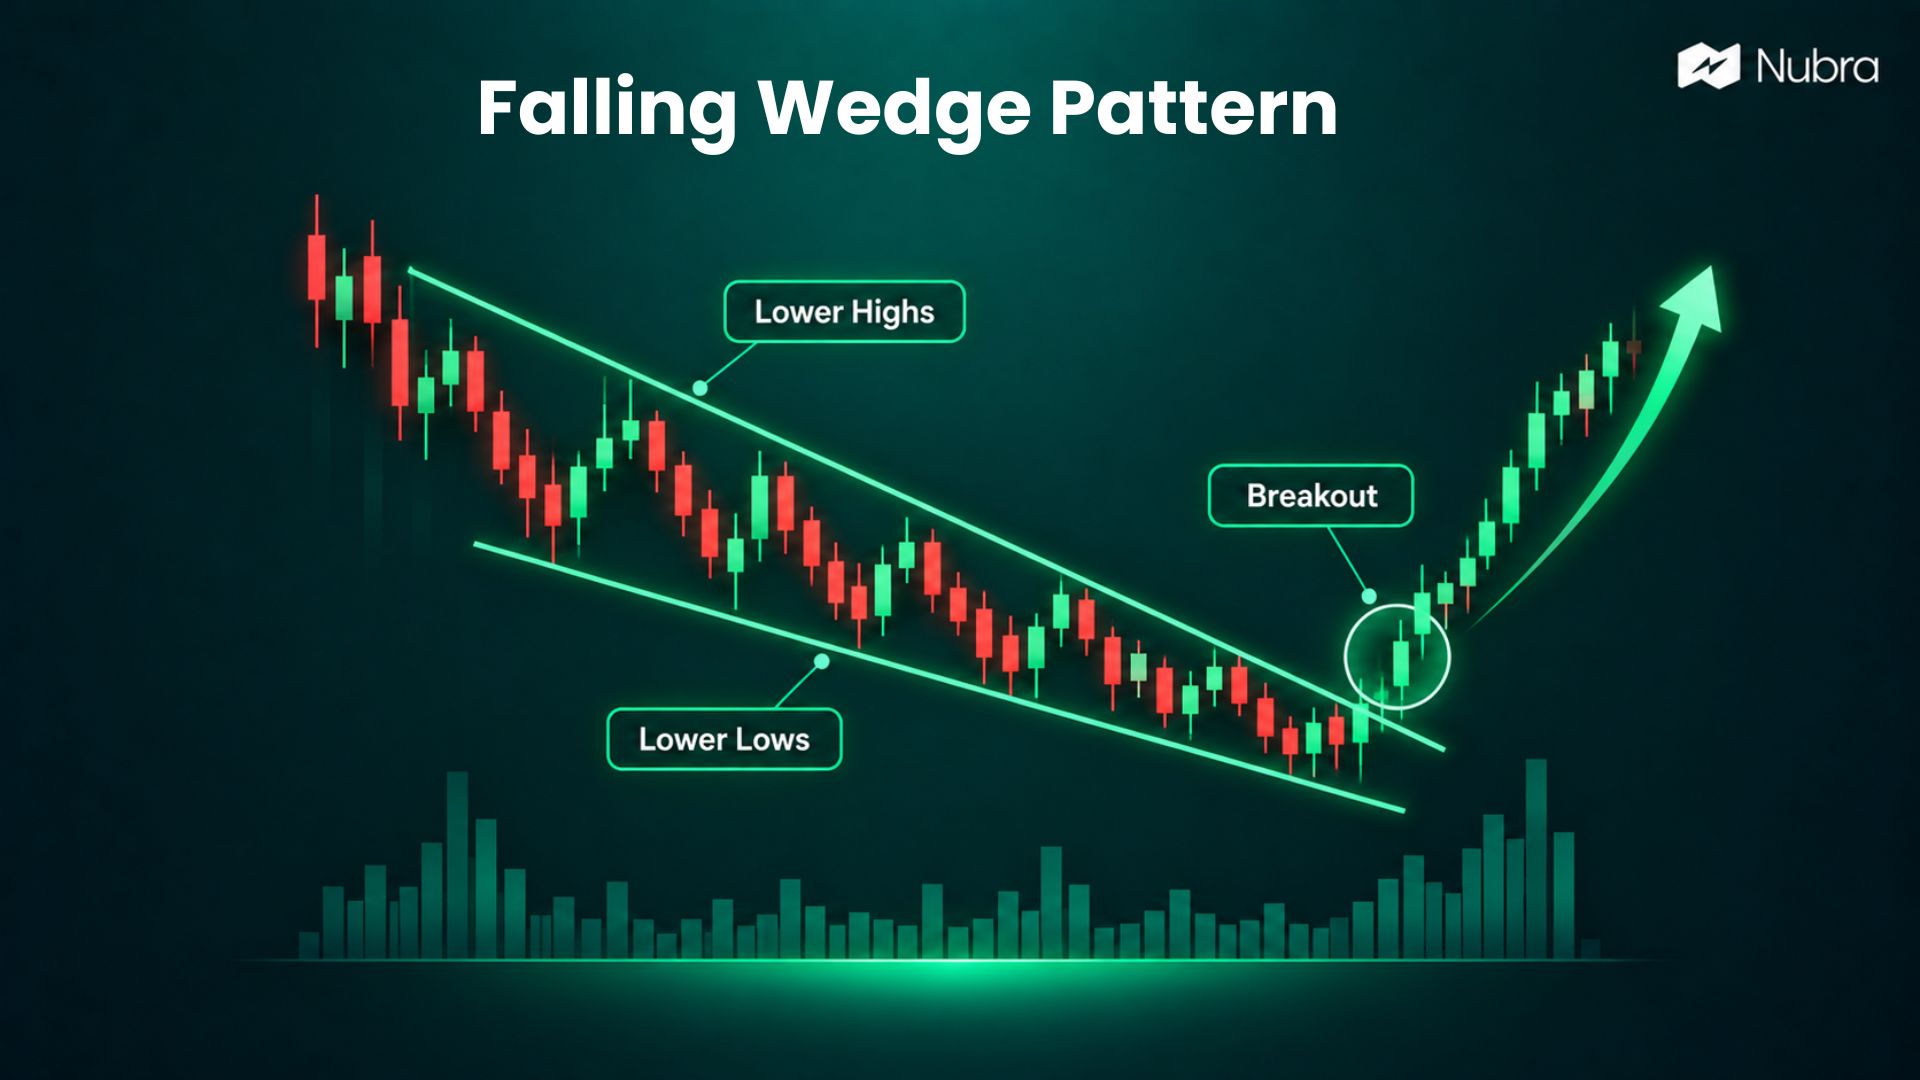
A falling wedge pattern forms when price makes lower highs and lower lows between two downward-sloping lines that gradually move closer together. It has a bullish bias, but we look for a break above the upper line before interpreting it as a bullish signal. The useful clue is the narrowing range: price is still falling,…

Money Flow Index

Money Flow Index (MFI): Meaning, Formula and How to Read It

When we study a price chart, we can see where a stock has moved. The Money Flow Index (MFI) adds another question: how does trading volume affect the strength of that move? MFI combines price and volume to estimate buying and selling pressure on a scale from 0 to 100. We can use it to…

Dead Cat Bounce

Dead Cat Bounce: Meaning, Example and Reversal Signals

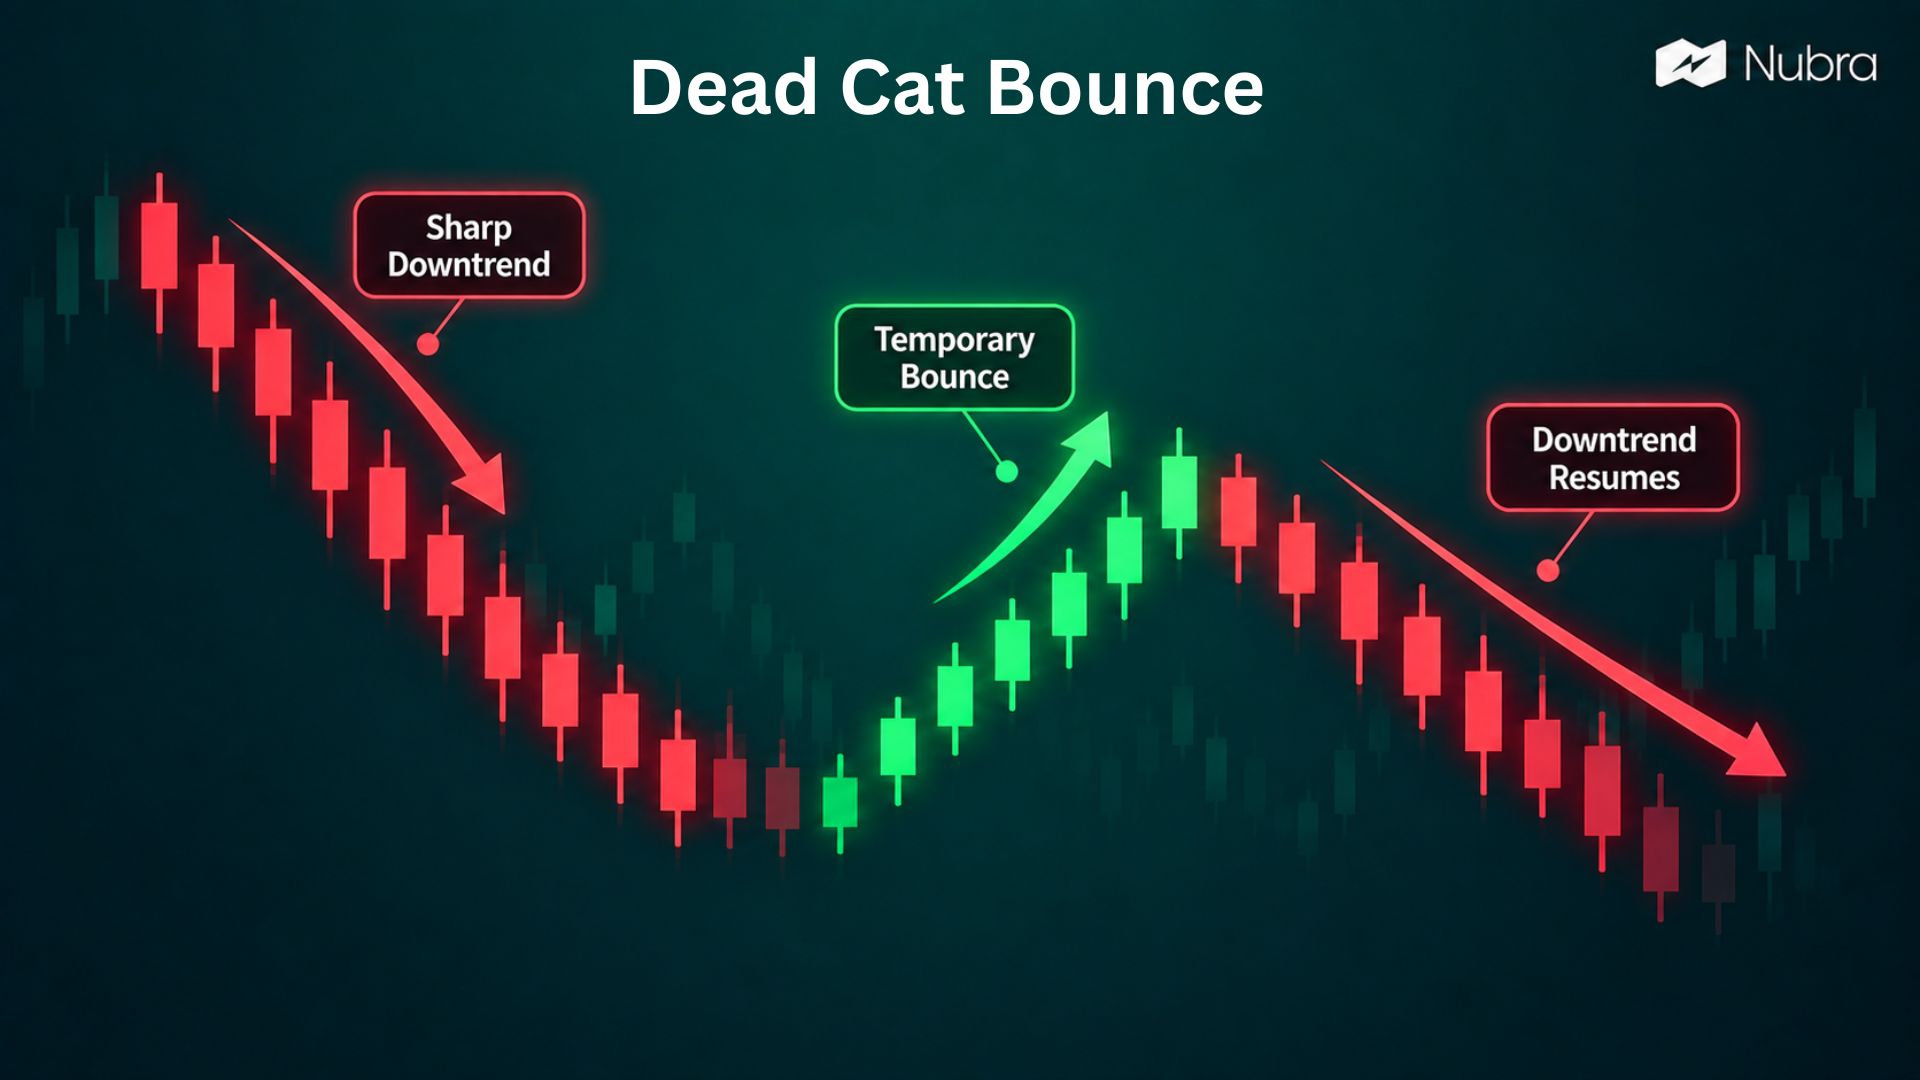
A dead cat bounce is a temporary rise in a stock or other asset after a sharp fall, followed by another decline. When we see prices recover after a sell-off, the key question is whether the recovery can last. The phrase describes a rebound that fails to change the broader downward trend. Its unusual name…

Receivable Turnover Ratio

Receivable Turnover Ratio: Meaning, Formula, Example, and Interpretation

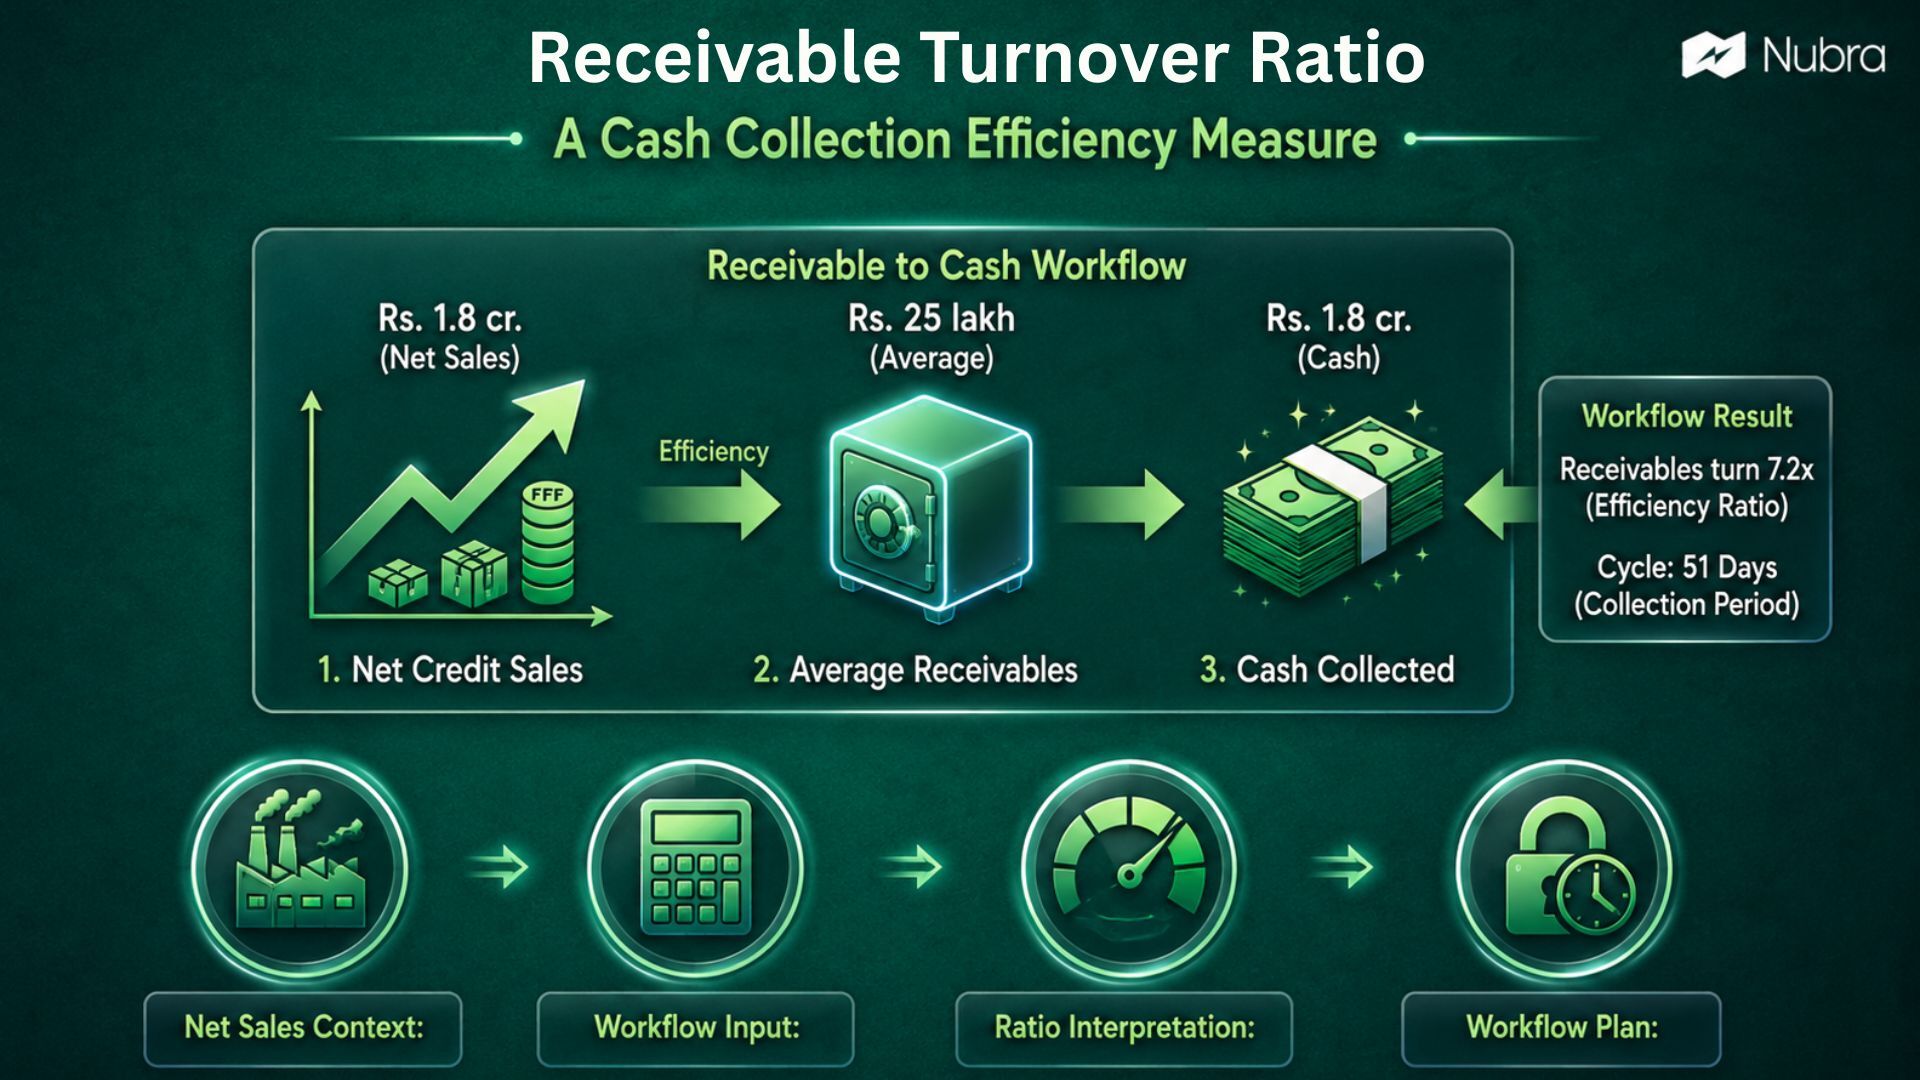
The receivable turnover ratio shows how efficiently a company collects money from customers who bought goods or services on credit. It tells us how many times, during a period, the company converts its average accounts receivable into cash. For traders and investors, this ratio is useful because sales growth does not always mean strong cash…

Double Bottom Pattern

Double Bottom Pattern: Meaning, Formation, and Trading Use

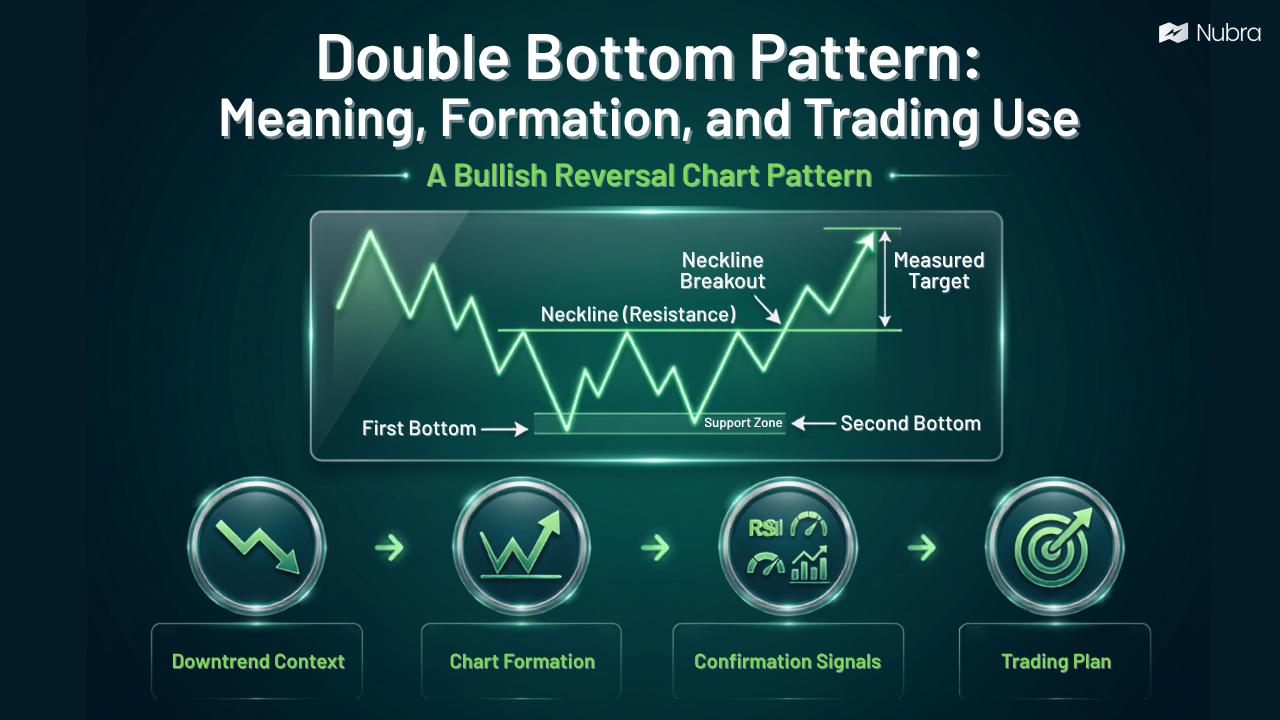
A double bottom pattern is a bullish reversal chart pattern that forms after a downtrend. It shows that price has tested a support zone twice, failed to break meaningfully lower, and then started moving back toward resistance. On a chart, it often looks like the letter W. For traders, the double bottom turns a messy…

Double Top Pattern

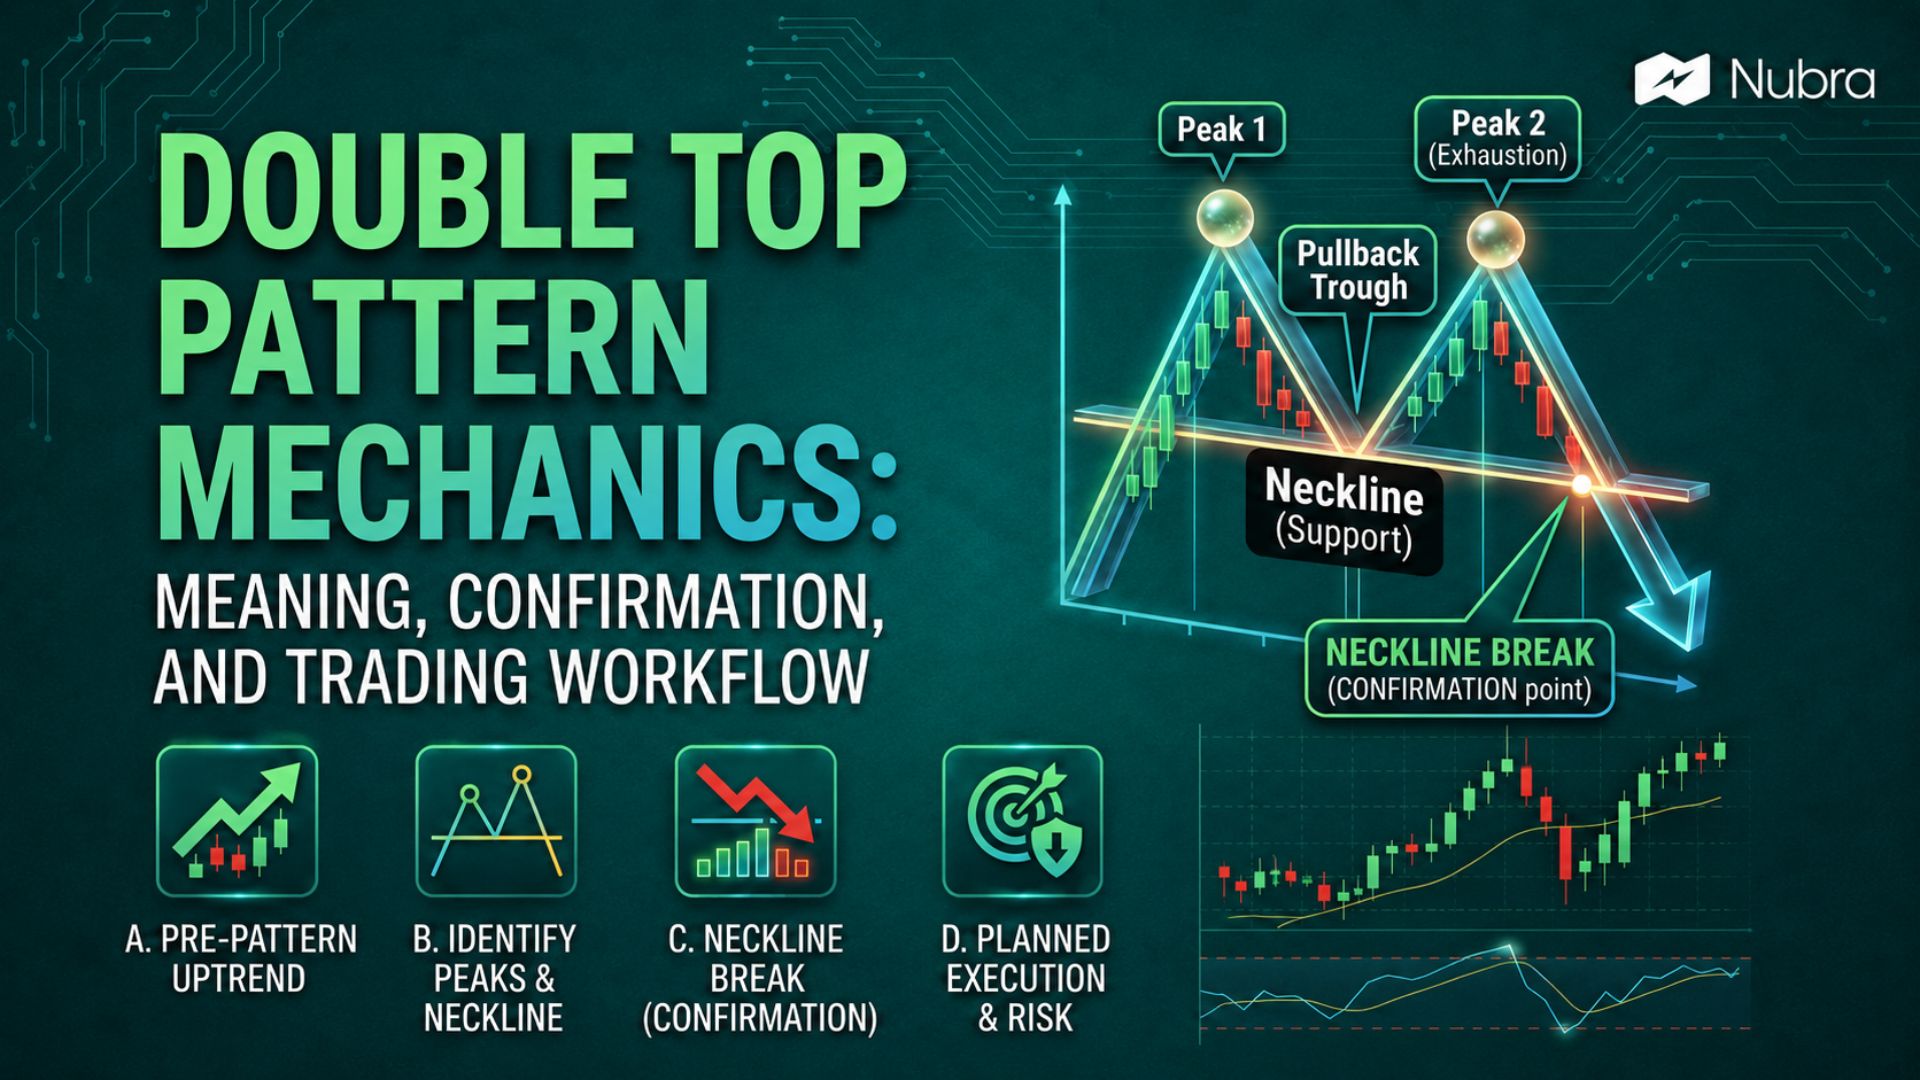
Double Top Pattern: Meaning, Confirmation, and Trading Workflow

A double top pattern is a bearish reversal chart pattern that forms after an uptrend. It appears when price rises to a resistance area, pulls back, rises again toward a similar high, and then fails to continue higher. The pattern starts to matter only when price breaks below the support area between the two peaks,…

Time Series Analysis

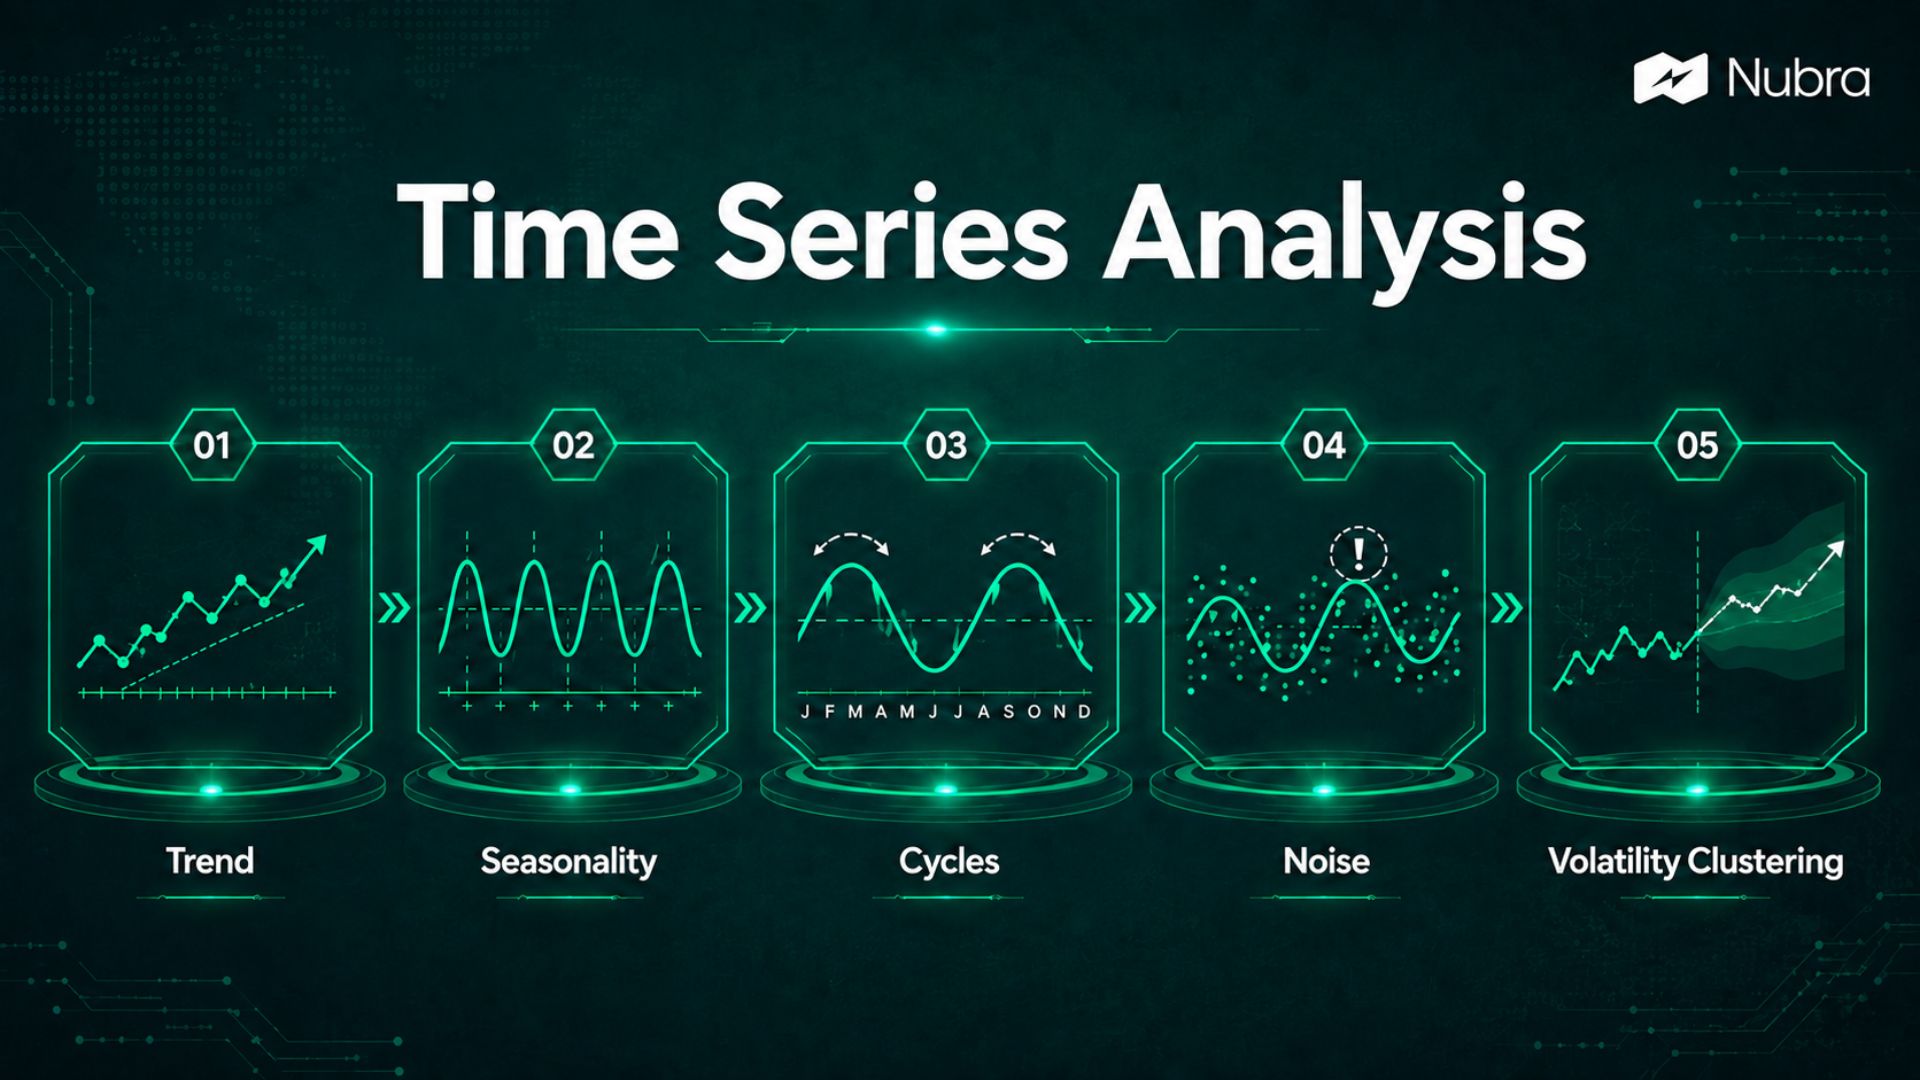
Time Series Analysis: Meaning, Methods, and Trading Uses

Time series analysis is the study of data points arranged in time order. In trading, this usually means looking at market data such as price, returns, volume, volatility, open interest, implied volatility, or indicator values across minutes, days, weeks, or months. The goal is simple: we study how a variable has behaved over time so…

Bullish Candlestick Patterns

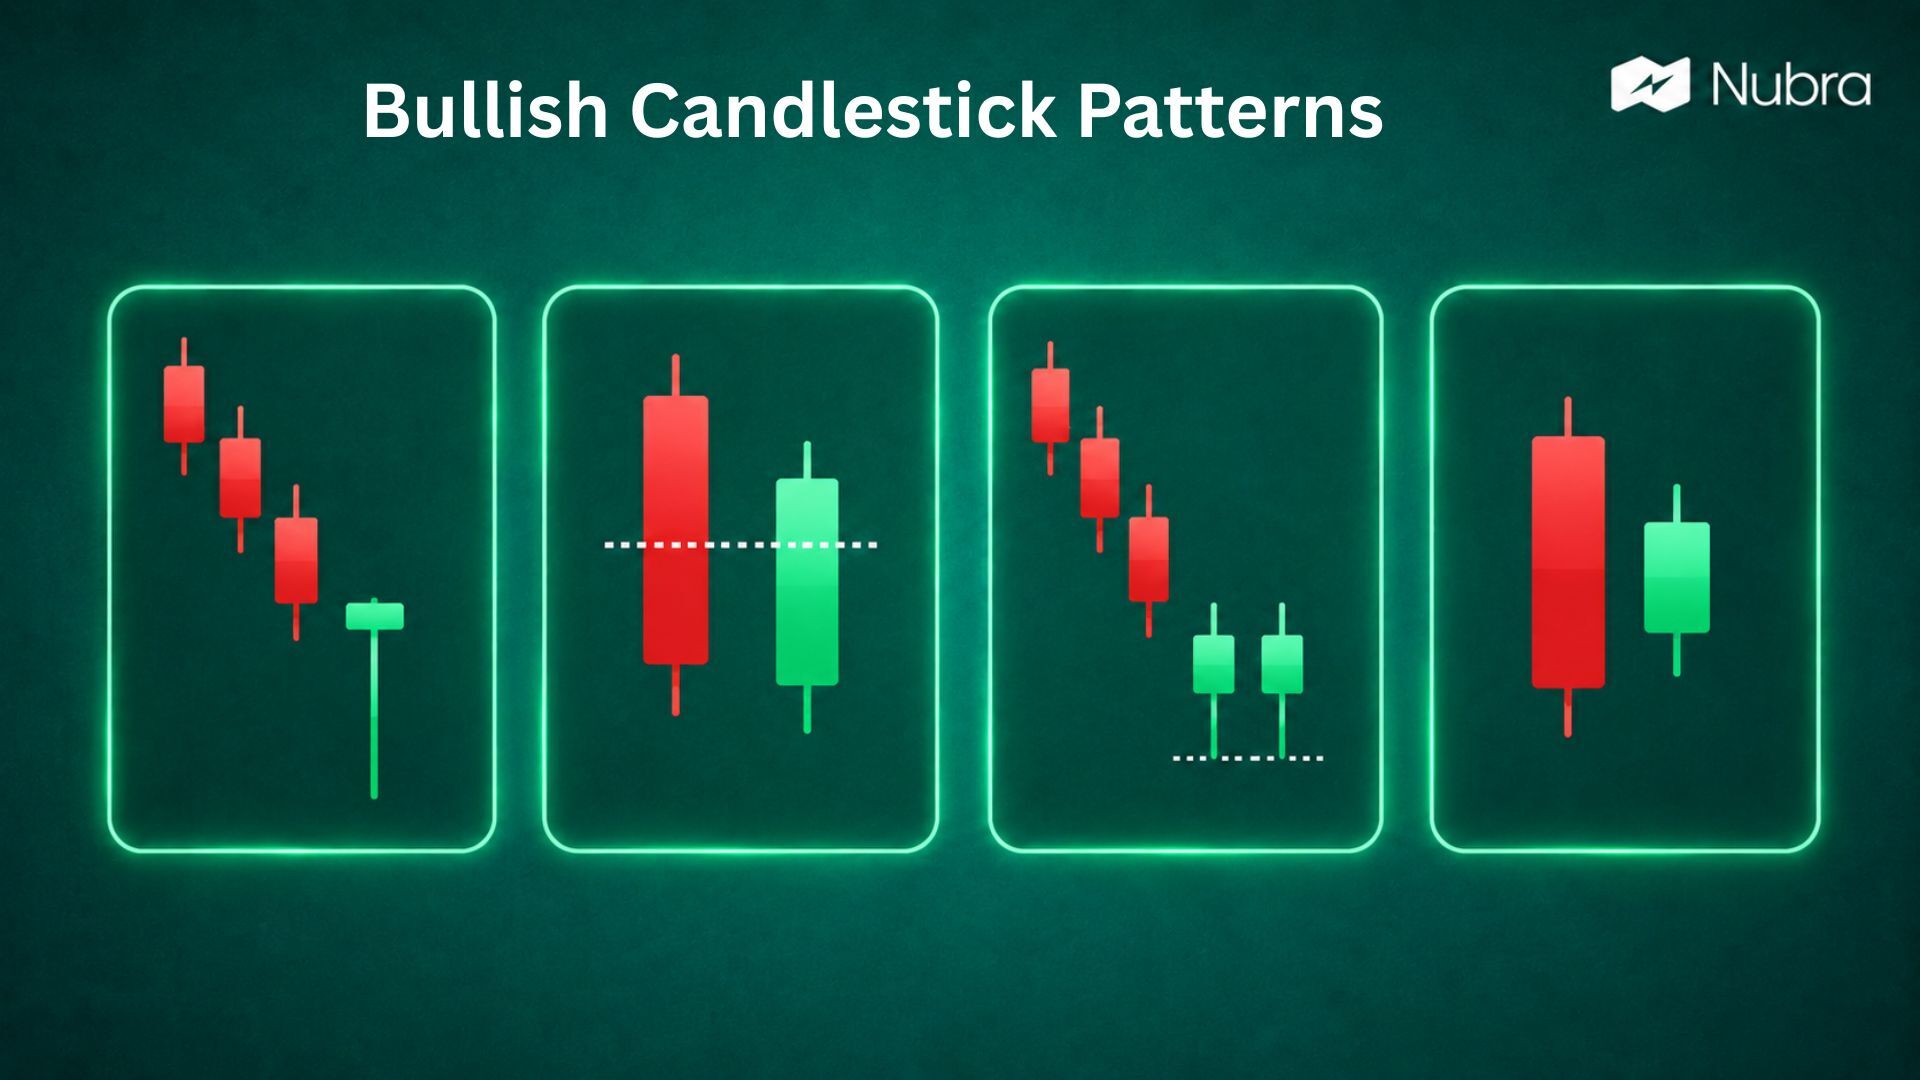
Bullish Candlestick Patterns: 9 Setups Traders Watch

Bullish candlestick patterns help traders read where buying interest may be returning to a chart. They are useful because they turn price action into a visual story: sellers tried to push the market lower, buyers responded, and the candle closed in a way that suggests the balance may be shifting. That shift is important, but…

Hammer Candlestick Patterns

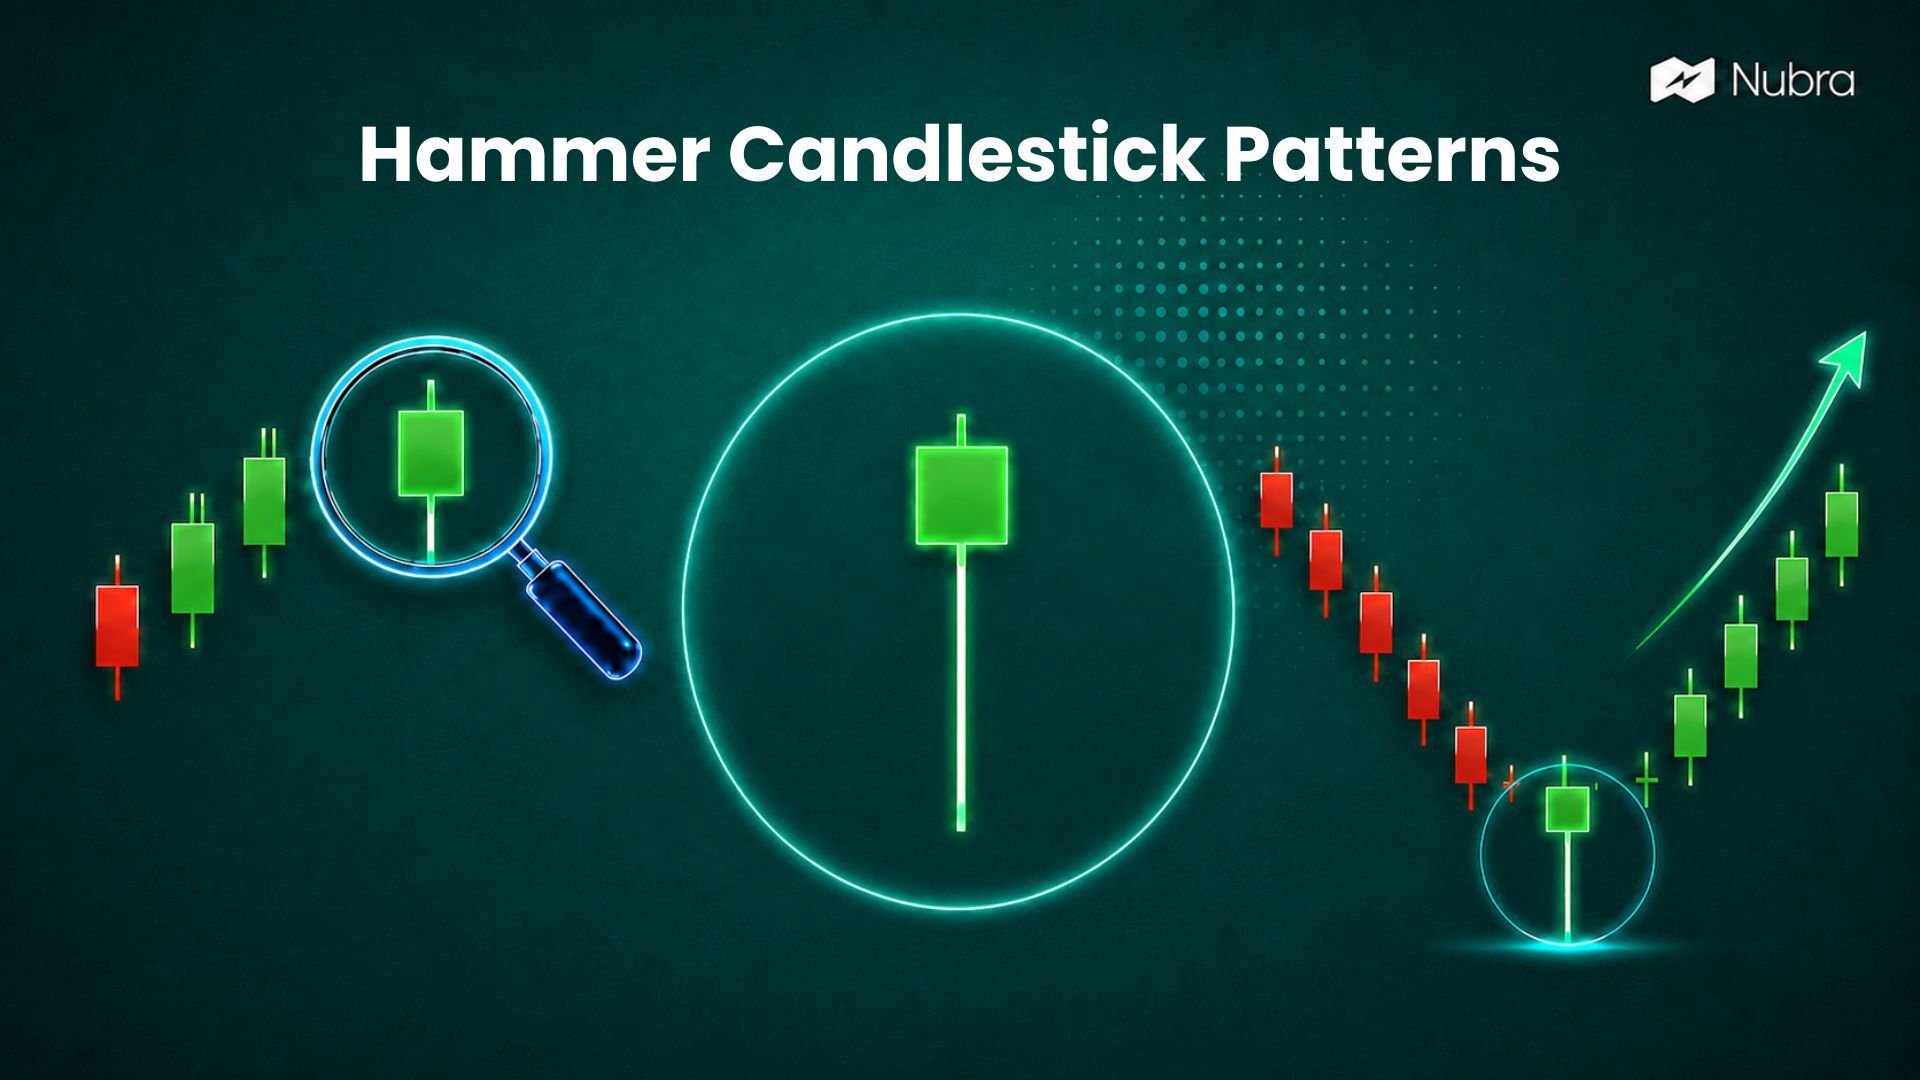
Hammer Candlestick Patterns: Meaning, Types, and Trading Use

A hammer candlestick pattern is a single-candle technical analysis pattern that appears after a price decline and signals a possible bullish reversal. It does not confirm a reversal by itself, but it shows that sellers pushed the price lower during the session and buyers were able to pull it back near the opening or closing…

MACD

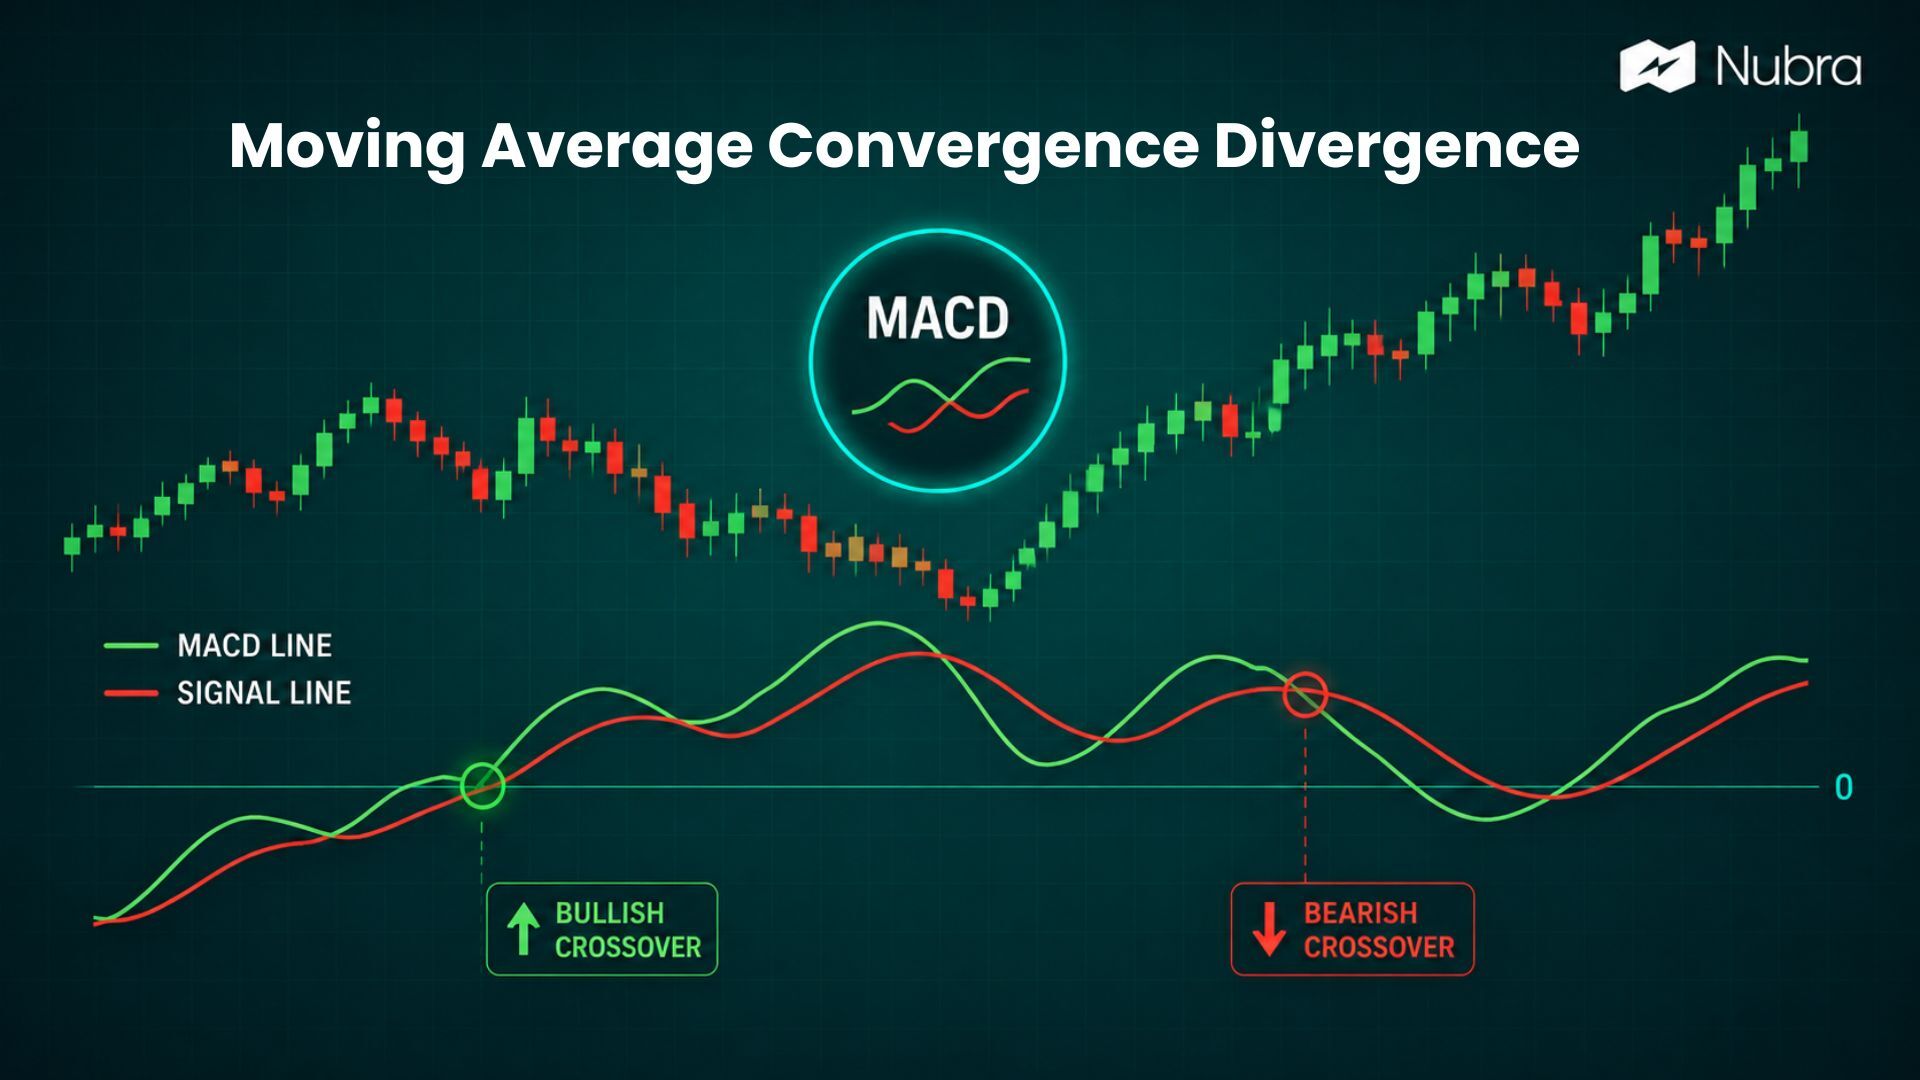
Moving Average Convergence Divergence (MACD): Meaning, Formula, and How Traders Read It

Moving Average Convergence Divergence, commonly called MACD, is a technical indicator that helps traders study trend direction and momentum. It compares two exponential moving averages of price, then turns that relationship into a line, a signal line, and a histogram. In simple terms, MACD helps us answer three practical questions on a chart: is momentum…