
Interactive: Options Strategy Explorer#
This interactive tool is designed to help you learn options strategies visually — not by memorizing payoff diagrams, but by experimenting with market expectations.
Instead of asking “Which strategy should I use?”, the chart encourages you to think:
“Where do I believe NIFTY could trade next?”
Based on that view, the tool helps you explore which strategies naturally fit that expectation.
How the Interactive Chart Works#
Use the chart below to project a future price range for NIFTY and explore how different options strategies behave within that range.
What you can do:#
- Drag a box in the shaded future projection area
- Suggested strategies update automatically
- Click any strategy to see:
- Strategy legs (BUY / SELL, strikes, premiums)
- Payoff curve
- Max profit and max loss
What Does “Draw the Box” Mean?#
When you draw a box in the shaded region, you are expressing your market belief:
- The top of the box represents where you think NIFTY might max out
- The bottom of the box represents where you think NIFTY might find support
- The height of the box reflects how volatile or stable you expect the market to be
The tool reads this range and suggests strategies that naturally benefit from that kind of market behavior.
Below is an image representation to show how the box projection looks
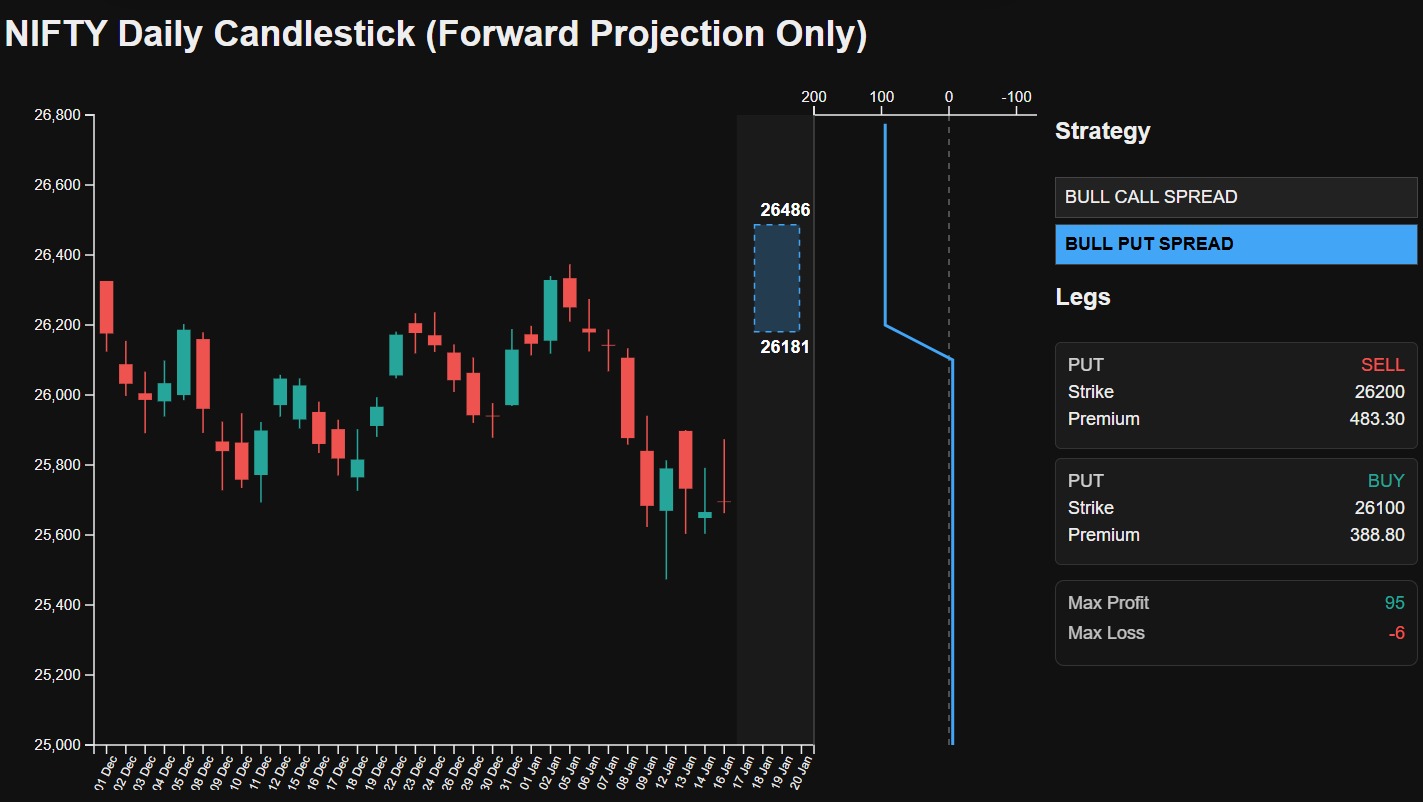
Think of the box as your forecast, not a trade.
Learn by Trying Different Market Views#
The real power of this tool comes from experimentation.
Try drawing:
- A tight range → notice how neutral strategies appear
- A wide range → observe how risk and payoff change
- A range above spot → bullish strategies emerge
- A range below spot → bearish strategies appear
Click each strategy and study:
- How many legs it has
- Where profit is capped
- Where losses are limited — or unlimited
- How payoff shape changes with structure
Over time, you’ll start to intuitively understand why certain strategies exist.
Strategy Payoff & Risk Intuition#
Each selected strategy displays:
- A live payoff curve
- Clear max profit and max loss
- Explicit indication when risk is unlimited (e.g. short straddles and strangles)
This helps build intuition around questions like:
- Why spreads limit risk
- Why neutral strategies collect premium
- Why some trades look attractive but carry hidden danger
Important Disclaimer#
This is a learning and visualization tool only.
- It does not account for execution costs, slippage, or real-time margin rules
- Option prices are static snapshots
- This is not trading advice
Use it to learn, explore, and question — not to place live trades blindly.
Final Thought#
Options make the most sense when you stop thinking in terms of tips and start thinking in terms of ranges and probabilities.
This tool is built to help you do exactly that — visually, interactively, and safely.
Draw boxes. Click strategies. Learn how options really work.