
Price alone tells you where the market is.
Gamma structure often tells you how the market might behave around important strikes.
That is the idea behind gamma walls. When option open interest is concentrated at certain levels and the associated gamma exposure becomes large enough, those strikes start mattering. They can act like magnets, friction zones, or trigger areas where market behavior changes once price moves through them.
That is where gamma-wall becomes useful.
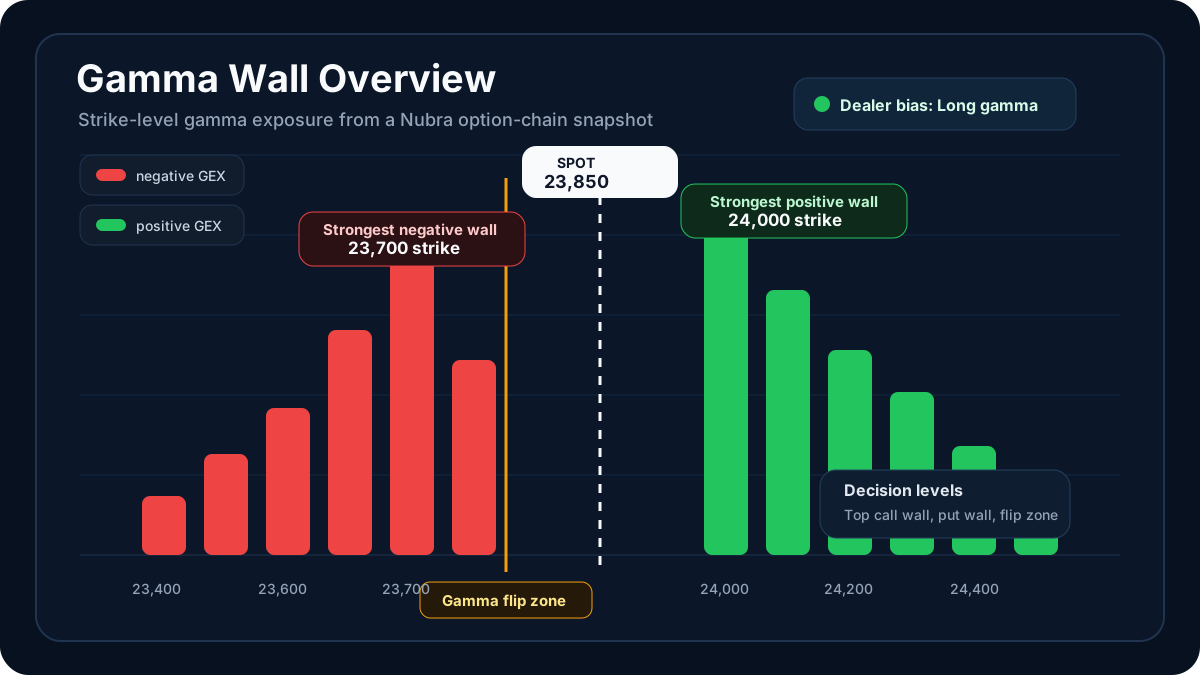
Available on PyPI, the package takes a Nubra option-chain snapshot and turns it into a readable gamma exposure report. It calculates contract-level GEX, aggregates it strike by strike, and then prints the levels traders usually care about most: the strongest positive wall, strongest negative wall, the gamma flip zone, the dealer positioning bias, and a summary of the key decision levels.
If you already work with the Nubra SDK and want a faster way to convert raw chain data into actionable gamma structure, this library gives you a very clean workflow.
Why Gamma Walls Matter#
In index options, not every strike carries the same weight.
Some strikes accumulate far more open interest and sit inside a much more meaningful gamma cluster than others. When that happens, those levels can become structurally important. They may slow price down, attract price back toward them, or, in the opposite regime, contribute to faster movement once the market slips away from the stabilizing zone.
That is why traders often care less about the full chain in isolation and more about a narrower set of questions:
Where is gamma concentrated? Which strike is carrying the strongest positive or negative exposure? Where does the chain appear to flip from one regime to another?
gamma-wall is built to answer those questions directly from the Nubra snapshot you already have.
What the Library Does#
At a high level, the package reads the option-chain response, pulls the CE and PE contracts, normalizes the fields it needs, and calculates Gamma Exposure (GEX) per contract using the standard gamma-times-open-interest-times-spot-squared approach.
Calls contribute positive gamma exposure, while puts are signed negative before the library computes net gamma by strike.
From there, it aggregates the chain into a strike-level view and surfaces the levels traders usually want first: the top gamma walls by absolute net gamma, the strongest positive wall, the strongest negative wall, the gamma flip zone, the total market gamma, the dealer bias, and the top call and put walls.
What makes this nice in practice is that the package is not trying to become a dashboard framework. It stays focused on analytics, prints a clean terminal report, and returns the aggregated DataFrame if you want to continue your own analysis.
Why the Design Is Practical#
One of the better design choices in gamma-wall is that it does not try to own the Nubra SDK session itself.
Instead, you authenticate with Nubra, request the option chain through your normal workflow, and pass that result into the library. The package then works on the snapshot object you already have. That separation keeps the library small, composable, and much easier to plug into bigger research or execution systems.
It also does not require you to reshape data into a frontend-friendly format. There is no JSON export step, no Streamlit dependency, and no React layer. The package is deliberately terminal-first.
That makes it especially useful for people building snapshot scripts, internal monitoring tools, or research notebooks that need gamma levels without a lot of extra plumbing.
Installation#
Install gamma-wall from PyPI. If you want prettier terminal tables, you can also install the optional table extras.
Using It with the Nubra SDK#
The minimal workflow is intentionally small.
You authenticate with Nubra, request the option chain through the normal market-data flow, and then pass that snapshot into the reporting layer. In practice, the workflow is simply: log in, pull the chain for the symbol you care about, and let the library summarize the gamma structure for you.
That function prints the report and also returns the aggregated strike-level DataFrame, which makes it easy to continue with your own logic afterward.
If you want to override spot manually instead of inferring it from the response, the library supports that as well.
Internally, the package can infer spot from several likely fields in the snapshot and also normalizes large exchange-native price values when they are clearly paise-like. That is a subtle detail, but it makes the library much easier to use against real-world responses.
What You Get Back#
The output is designed for fast reading.
At the report level, the package prints the symbol, spot, expiry, top gamma walls, strongest positive wall, strongest negative wall, gamma flip zone, dealer positioning, total market gamma, and the top call and put walls.
At the API level, the library keeps a small but useful surface for deeper control over calculation, aggregation, summary, and terminal output.
This is a good split.
If you want the fastest path, the built-in reporting flow is enough. If you want more control, you can work with the contract-level and strike-level outputs directly and extract the important levels programmatically. Internally, the gamma flip logic looks for where ordered strike-level net gamma changes sign and, when multiple candidates exist, favors the one nearest spot if a spot price is available.
That keeps the package useful for both discretionary traders and systematic workflows.
Why This Library Is Useful#
The real strength of gamma-wall is that it removes the repetitive part of gamma analysis.
Instead of manually scanning the chain, guessing which strikes matter most, and then trying to summarize the structure by hand, you get a repeatable process:
take the Nubra snapshot, calculate signed gamma exposure, collapse it to strike level, and read the important zones immediately.
That is valuable because gamma analysis is usually not hard in theory. It is hard to do quickly and consistently enough to be useful across many sessions.
This library makes that step lighter without turning it into a bulky platform.
Final Thoughts#
gamma-wall is a focused library, and that is exactly why it works.
It does one job well:
turning a raw Nubra option-chain snapshot into a readable gamma map of the market.
For traders and developers who care about strike-level positioning, gamma flip zones, and broader dealer-gamma context, it is a strong building block. And because it returns structured pandas output in addition to the terminal report, it is just as useful in research code as it is in lightweight live monitoring scripts.