
Most traders look at implied volatility only after something important has already happened.
By then, the change is visible to everyone.
What usually matters more is being able to monitor how IV is moving intraday, especially around the at-the-money strike, across multiple symbols at once. That is exactly where nubra-iv-monitor becomes useful.
Available on PyPI, the library is built on top of the Nubra SDK and is designed to track real-time intraday ATM Implied Volatility for NSE options. It fetches the ATM call and put, averages their IV, normalises the move from the open, plots the change on a shared chart, and can also hand back a structured DataFrame on every candle close.
Instead of checking one option chain after another, you get a cleaner way to compare volatility behavior across a watchlist in one workflow.
Why ATM IV Matters#
In options trading, the at-the-money strike is often the most practical place to watch volatility behavior.
It sits closest to the current underlying price, reacts quickly to changes in demand for optionality, and usually gives a clearer intraday read than randomly sampling strikes across the chain.
That becomes especially useful when you are watching for:
- IV buildup before an event
- intraday volatility expansion
- post-event IV cooling
- relative IV movement across symbols
- early signs of IV crush
The challenge is not understanding why IV matters.
The challenge is tracking it consistently enough to compare names in real time.
That is the problem nubra-iv-monitor is built to solve.
What the Library Does#
At a high level, the library performs a focused sequence of tasks.
It first fetches the current underlying price, then pulls the option chain for that symbol, identifies the ATM strike, resolves the actual CE and PE option symbols through the instrument layer, and requests the historical IV midpoint data for both contracts.
From there, it averages CE and PE ATM IV into a single series for that stock.
That series is then normalised from the market open, which is what makes comparison powerful. Instead of comparing raw IV levels across symbols with very different volatility regimes, you compare how much IV has moved since the open.
That is a much more useful lens if you are trying to spot where volatility is expanding, compressing, or potentially setting up for a crush.
The Visual Output#
When plotting is enabled, nubra-iv-monitor opens a live matplotlib chart where all tracked symbols sit on the same graph.
Each line starts at zero from the open, each symbol is labelled near the endpoint, and the chart refreshes on every candle close. The implementation also saves a snapshot image, which is useful if you want a quick exported view of the current IV structure.
Here is what that looks like:
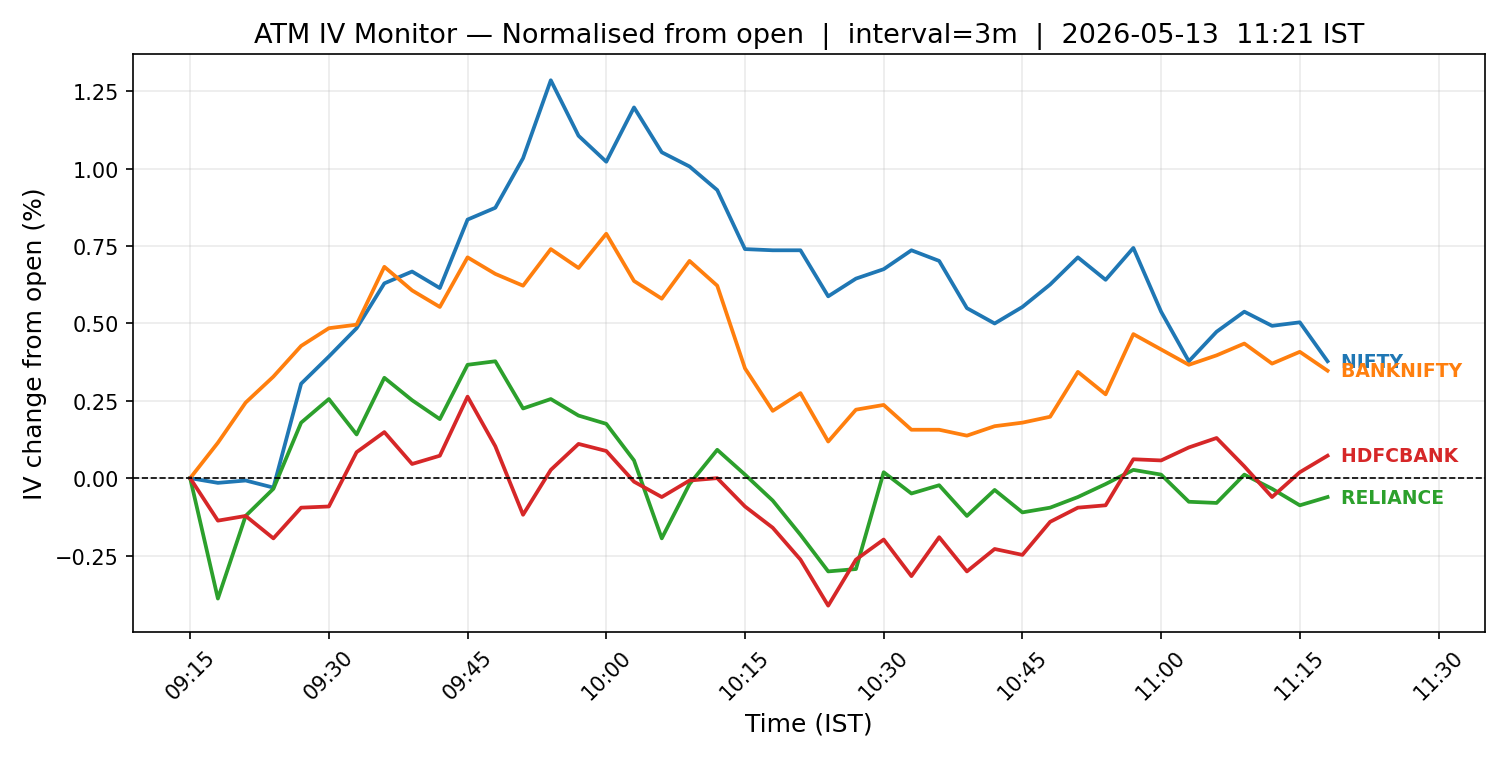
This makes the library immediately practical for intraday monitoring because you are not just logging values. You are seeing relative IV movement across names in one place.
Installation#
Install the package from PyPI.
Based on the package metadata, the library targets Python 3.9+ and depends on:
- Nubra SDK 0.3.8 or newer
- pandas 2.0 or newer
- matplotlib 3.7 or newer
You will also need an active Nubra account with API access.
What You Get on Every Update#
The monitor is not just a charting wrapper.
On every pass, it can build a structured DataFrame and hand it to an update callback. That callback receives a long-format table containing:
- candle time in IST
- stock symbol
- average ATM IV percentage
- IV change from open
- ATM CE symbol
- ATM PE symbol
- current underlying price
- ATM strike
This makes the library easy to extend into larger workflows.
You can use the callback to:
- print the latest IV snapshot per stock
- trigger alerts on volatility drops or spikes
- log intraday IV moves into a database
- build dashboards
- combine IV behavior with separate strategy logic
That is what makes the tool more useful than a standalone chart. It gives you a reusable intraday volatility data layer.
Why the Market-Open Alignment Matters#
One subtle but important detail in the implementation is that refresh timing is aligned to the NSE candle grid from 09:15 IST.
For example, a five-minute monitor aligns to closes like 09:20, 09:25, 09:30, and so on. A fifteen-minute monitor aligns to 09:30, 09:45, 10:00, and so on.
That matters because the monitor is not updating at arbitrary intervals. It is updating on actual candle boundaries, which keeps both the chart and the callback output much more coherent for intraday use.
When continuous mode is enabled, the script keeps re-running on every candle close while the market is open. If the market is closed, it waits and rechecks until the session resumes.
Continuous Monitoring and Headless Use#
The library supports both continuous and one-shot modes.
If you want a single read and exit, use one-shot mode. If you want the monitor to keep running through the session, use continuous mode. And if you are running it in a server or no-display setup, you can disable plotting entirely.
That makes nubra-iv-monitor flexible enough for both discretionary desktop use and automated backend workflows.
Why This Library Is Useful#
What makes nubra-iv-monitor strong is not just that it fetches IV.
It packages a full intraday ATM IV workflow into one small, usable interface:
- find the ATM strike
- resolve the correct CE and PE instruments
- fetch their IV data
- average them cleanly
- normalise the move from open
- visualize multiple symbols together
- expose the data programmatically
That saves time, removes repetitive plumbing, and makes it much easier to turn an IV idea into a working tool.
For traders and quants who care about IV crush, event-volatility behavior, or relative volatility movement across symbols, that is a meaningful advantage.
Final Thoughts#
nubra-iv-monitor is useful because it stays focused.
It does not try to become a full options analytics platform. It solves one specific problem well:
tracking intraday ATM implied volatility across multiple underlyings in a way that is visual, comparable, and programmable.
If you already work with the Nubra SDK and want a cleaner way to monitor intraday volatility behavior from the open, this library gives you a strong starting point for both discretionary monitoring and systematic IV workflows.