
Most trading dashboards fail in one of two ways.
They either look polished but say very little, or they contain everything and help with almost nothing.
This trading desk was built to avoid both.
The goal was not to create another generic market dashboard. The goal was to build a product around two questions a trader can act on quickly:
- Where is participation suddenly abnormal?
- What is the current options structure saying about index pressure?
That is why the desk is deliberately narrow.
It focuses on volume breakouts and OI wall structure, then builds the rest of the experience around those two lenses.
That narrowness is the point. Nubra APIs are useful when they help turn raw market data into a decision surface, not just another feed on screen.
Live Dashboard Preview#
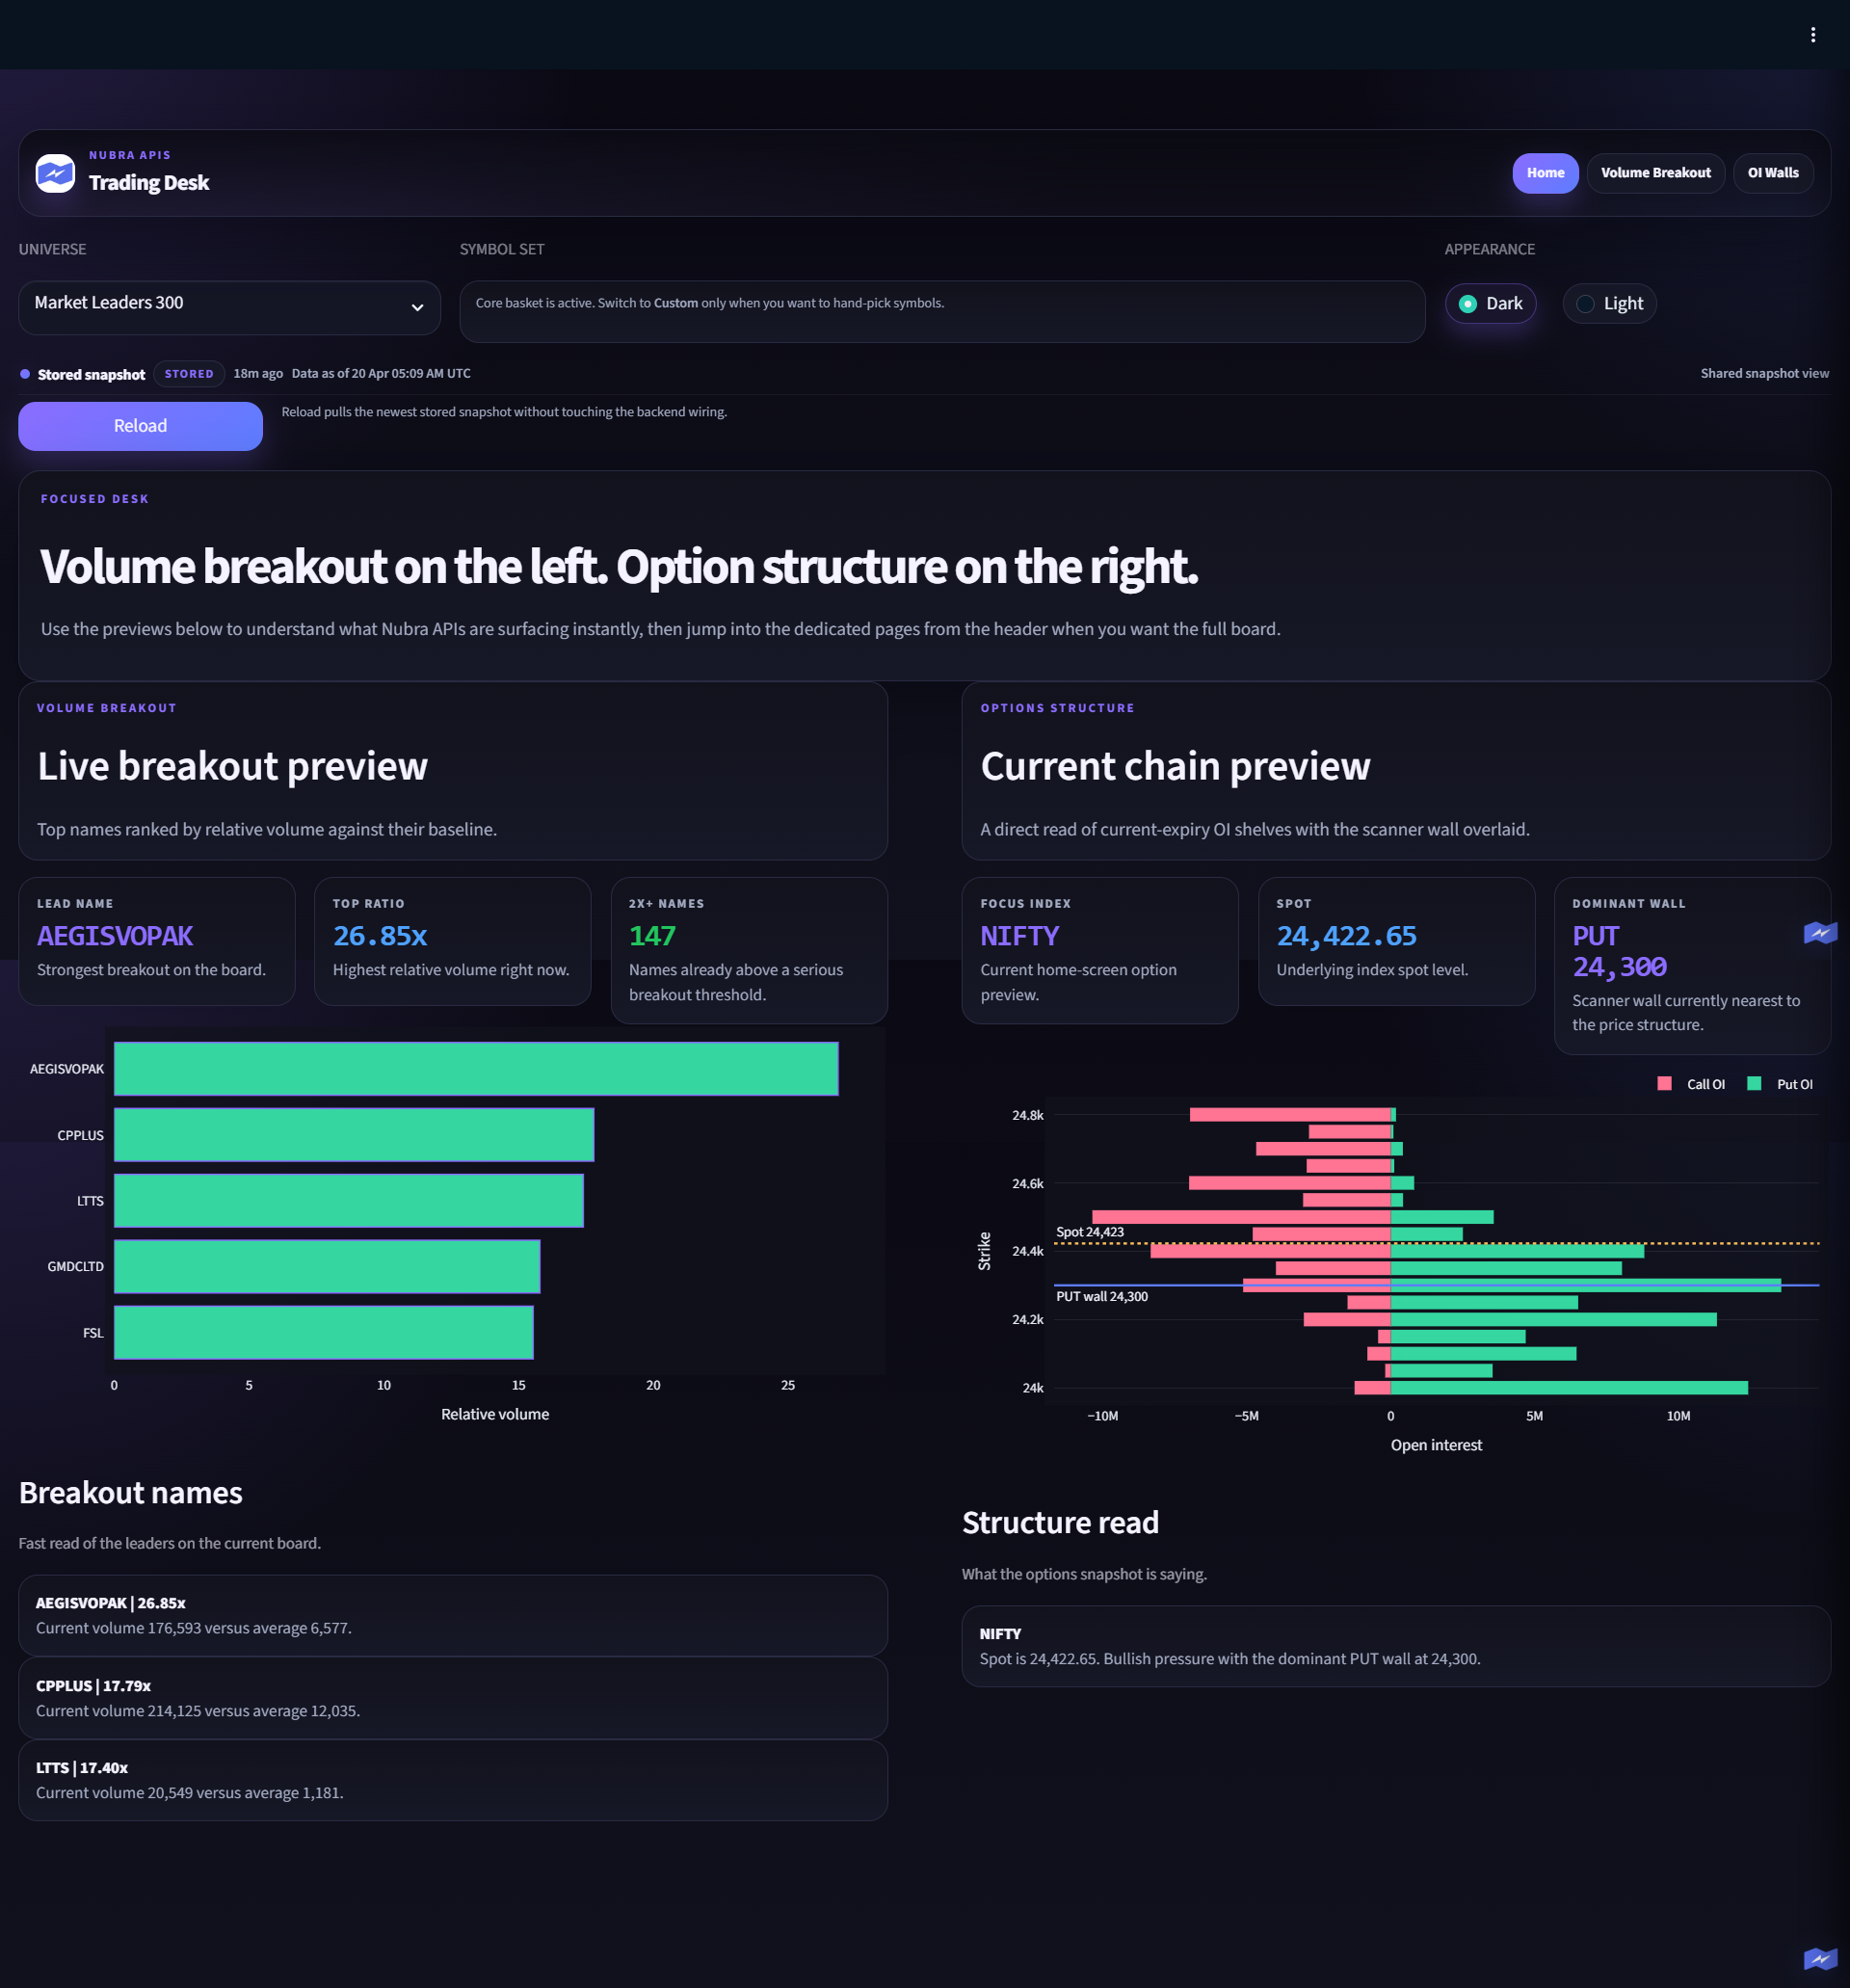
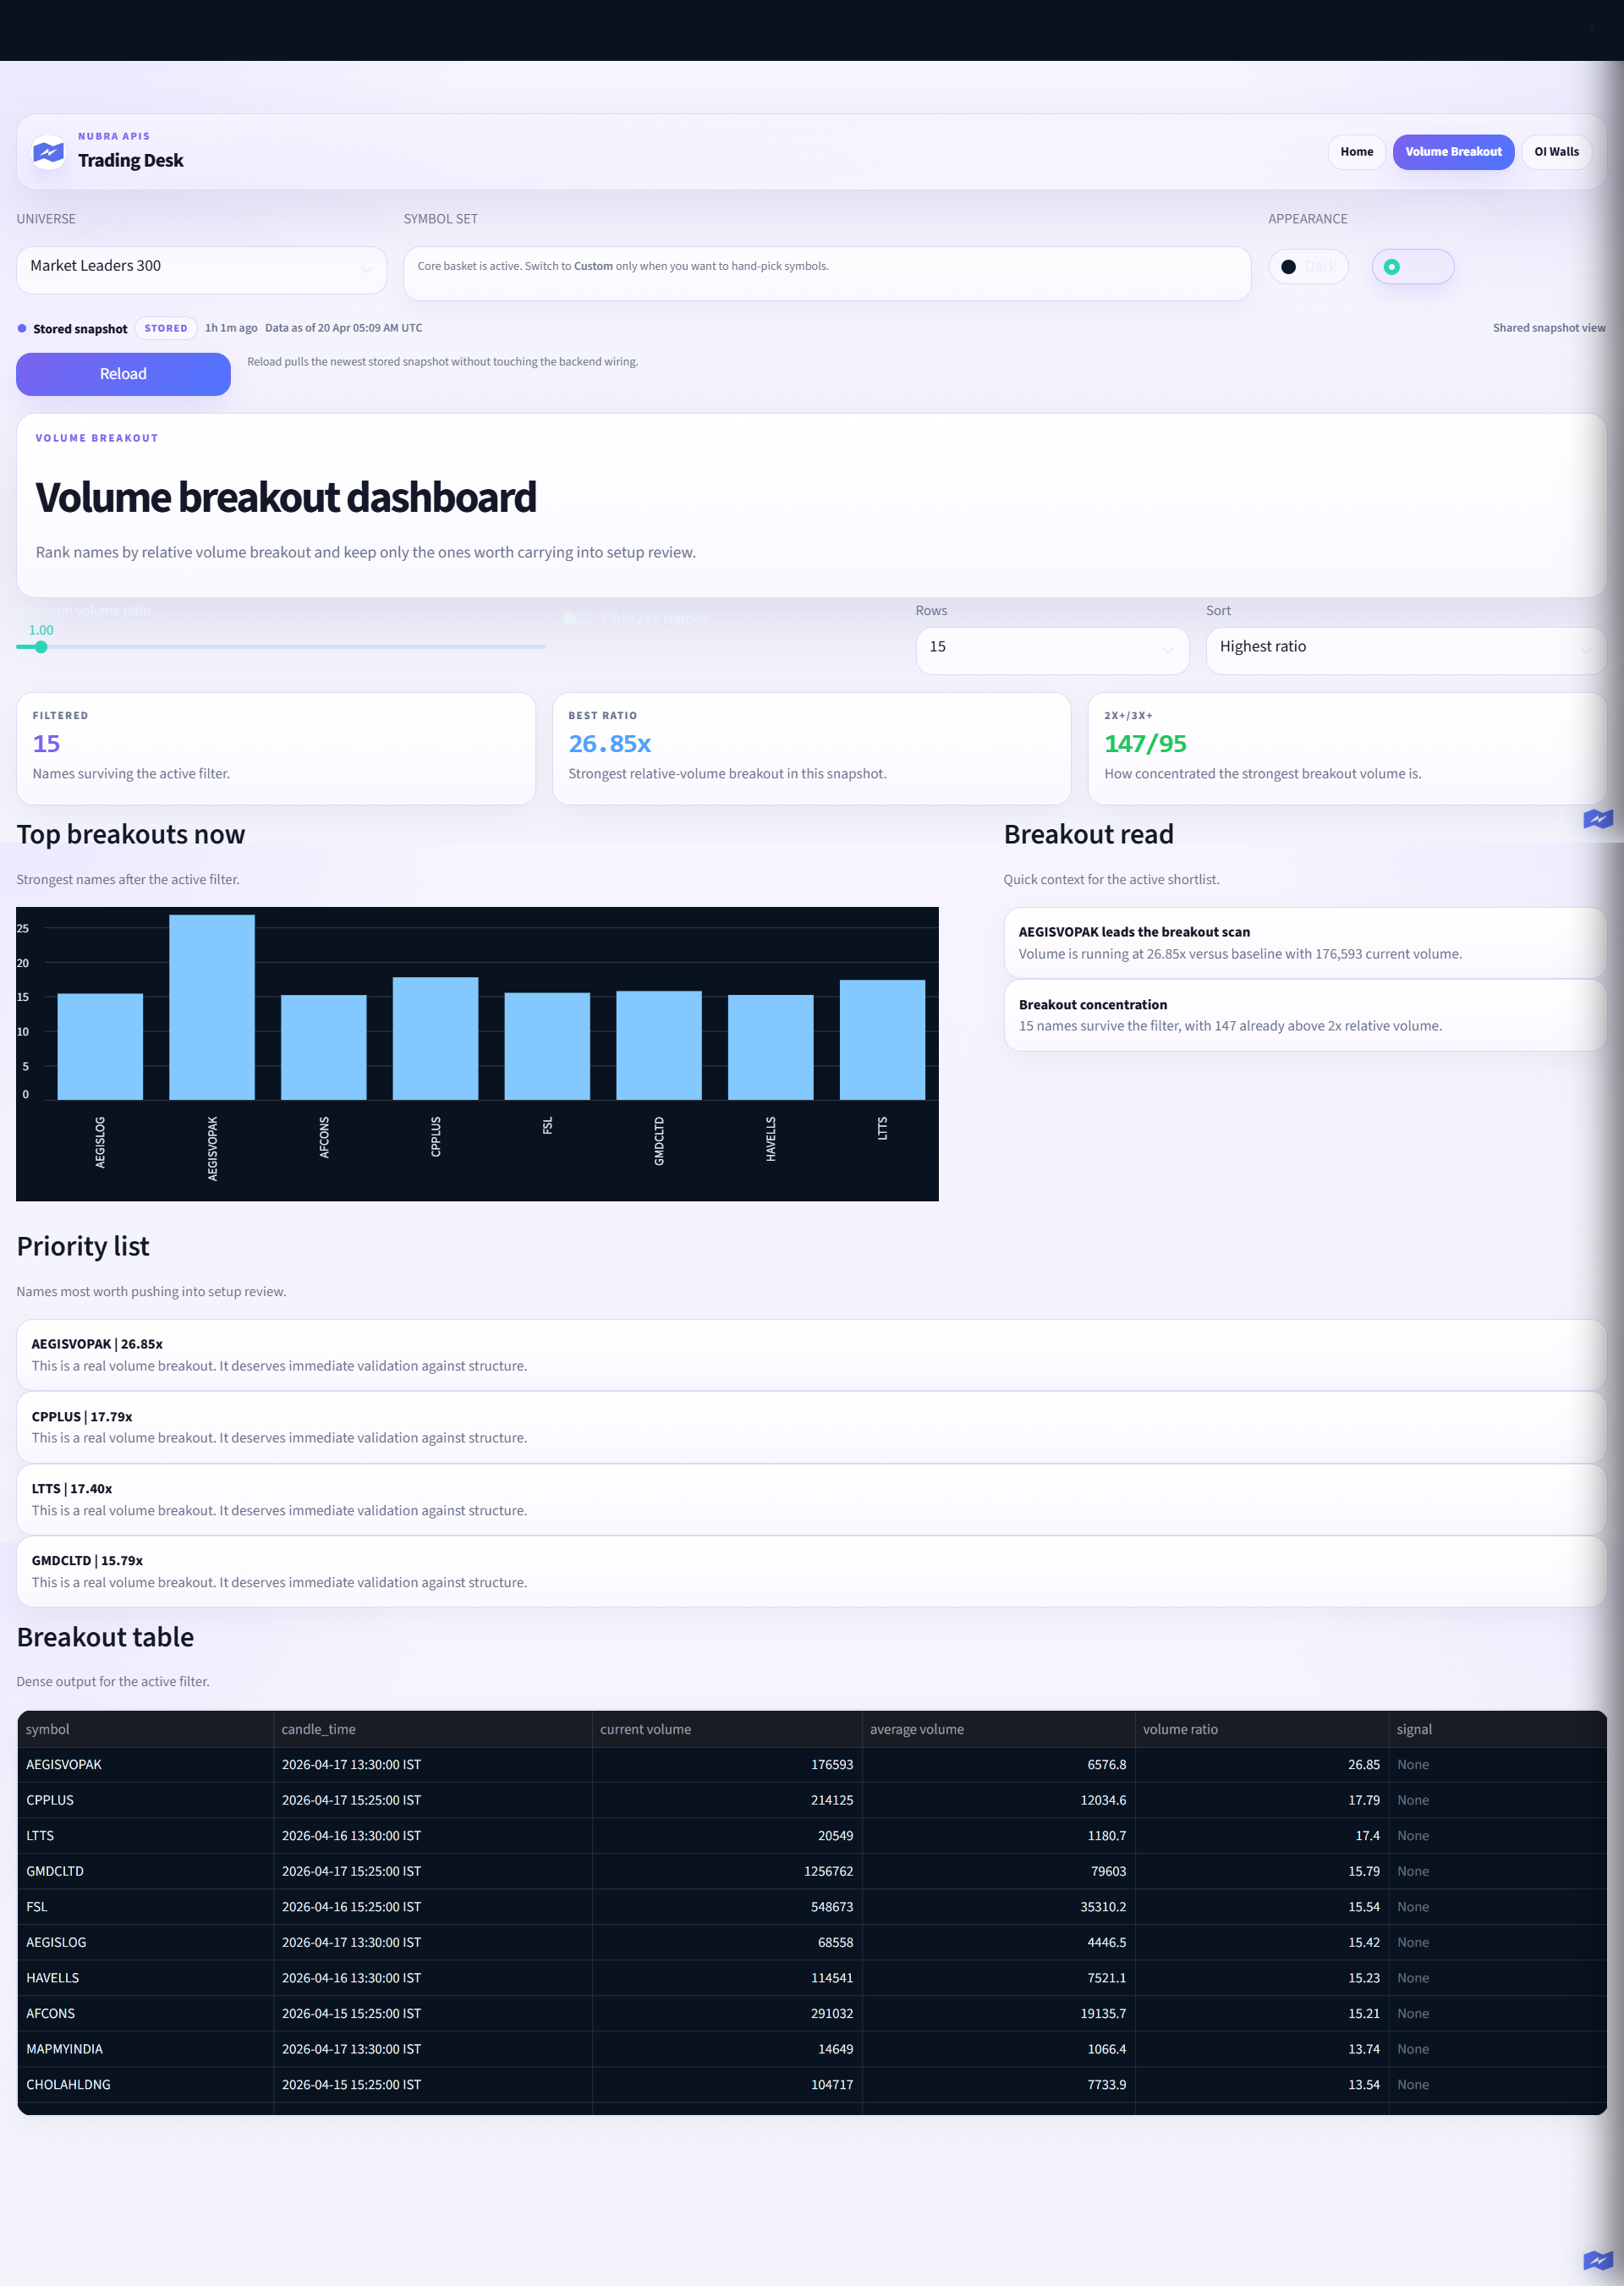
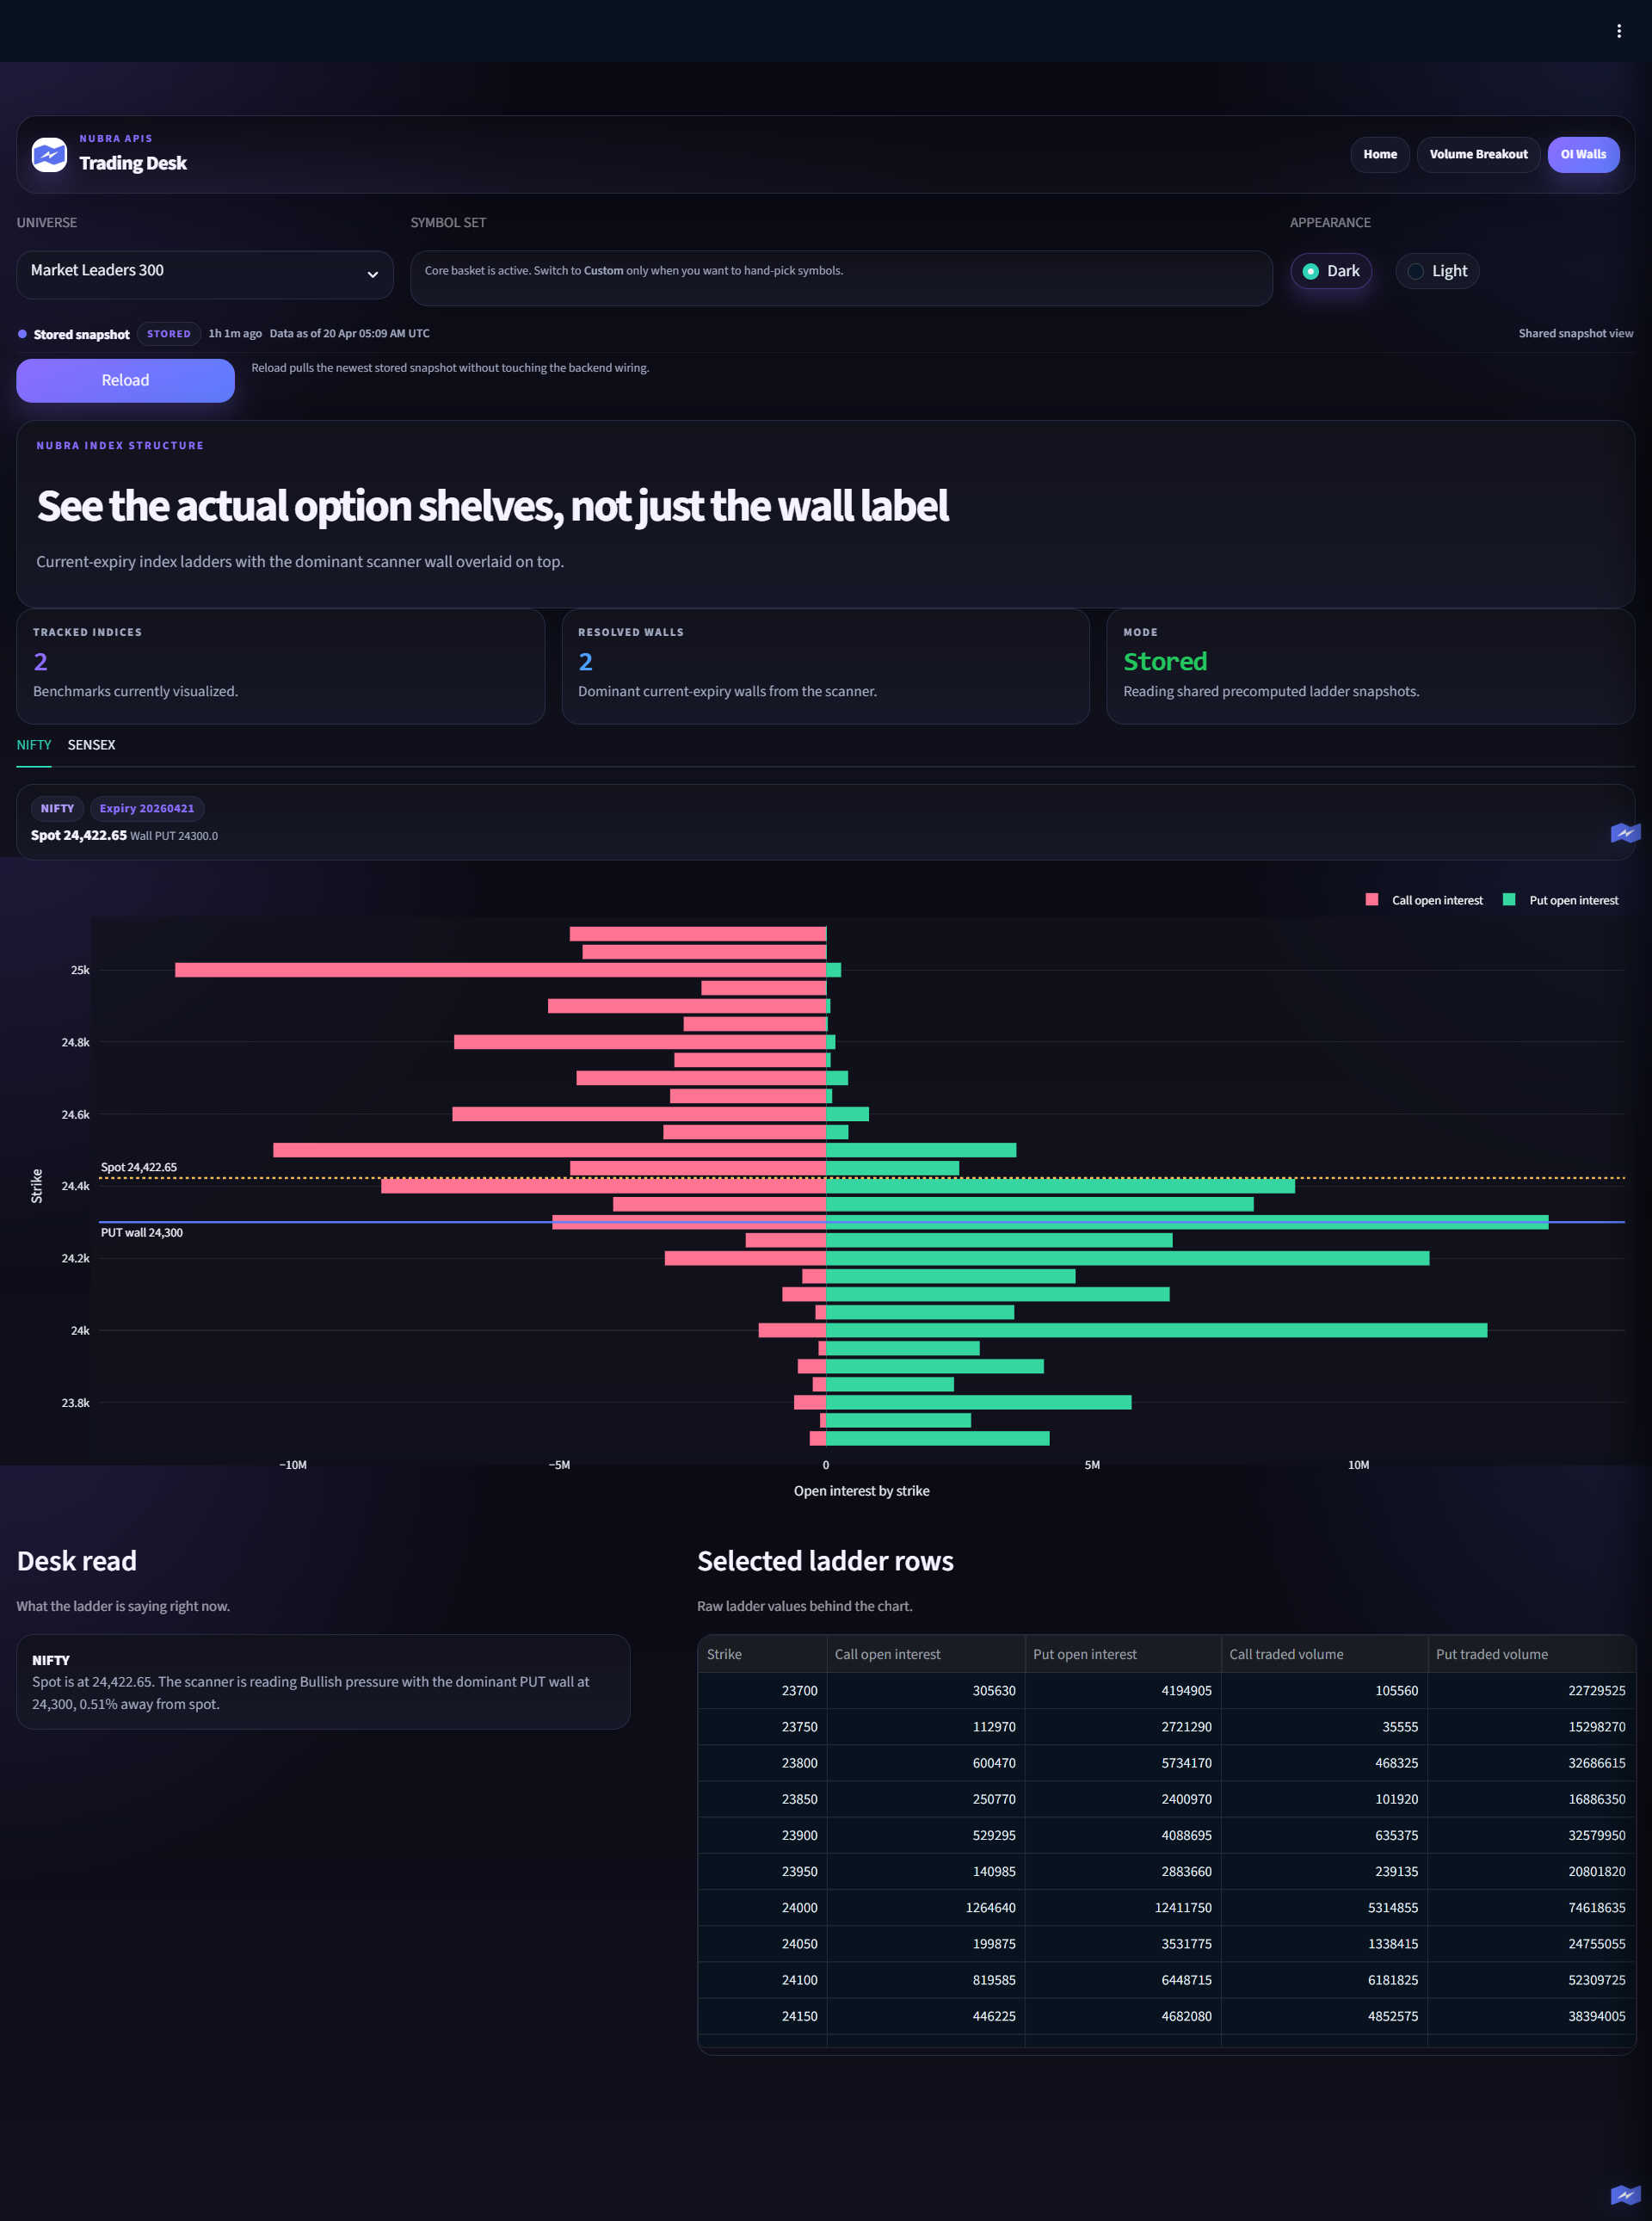
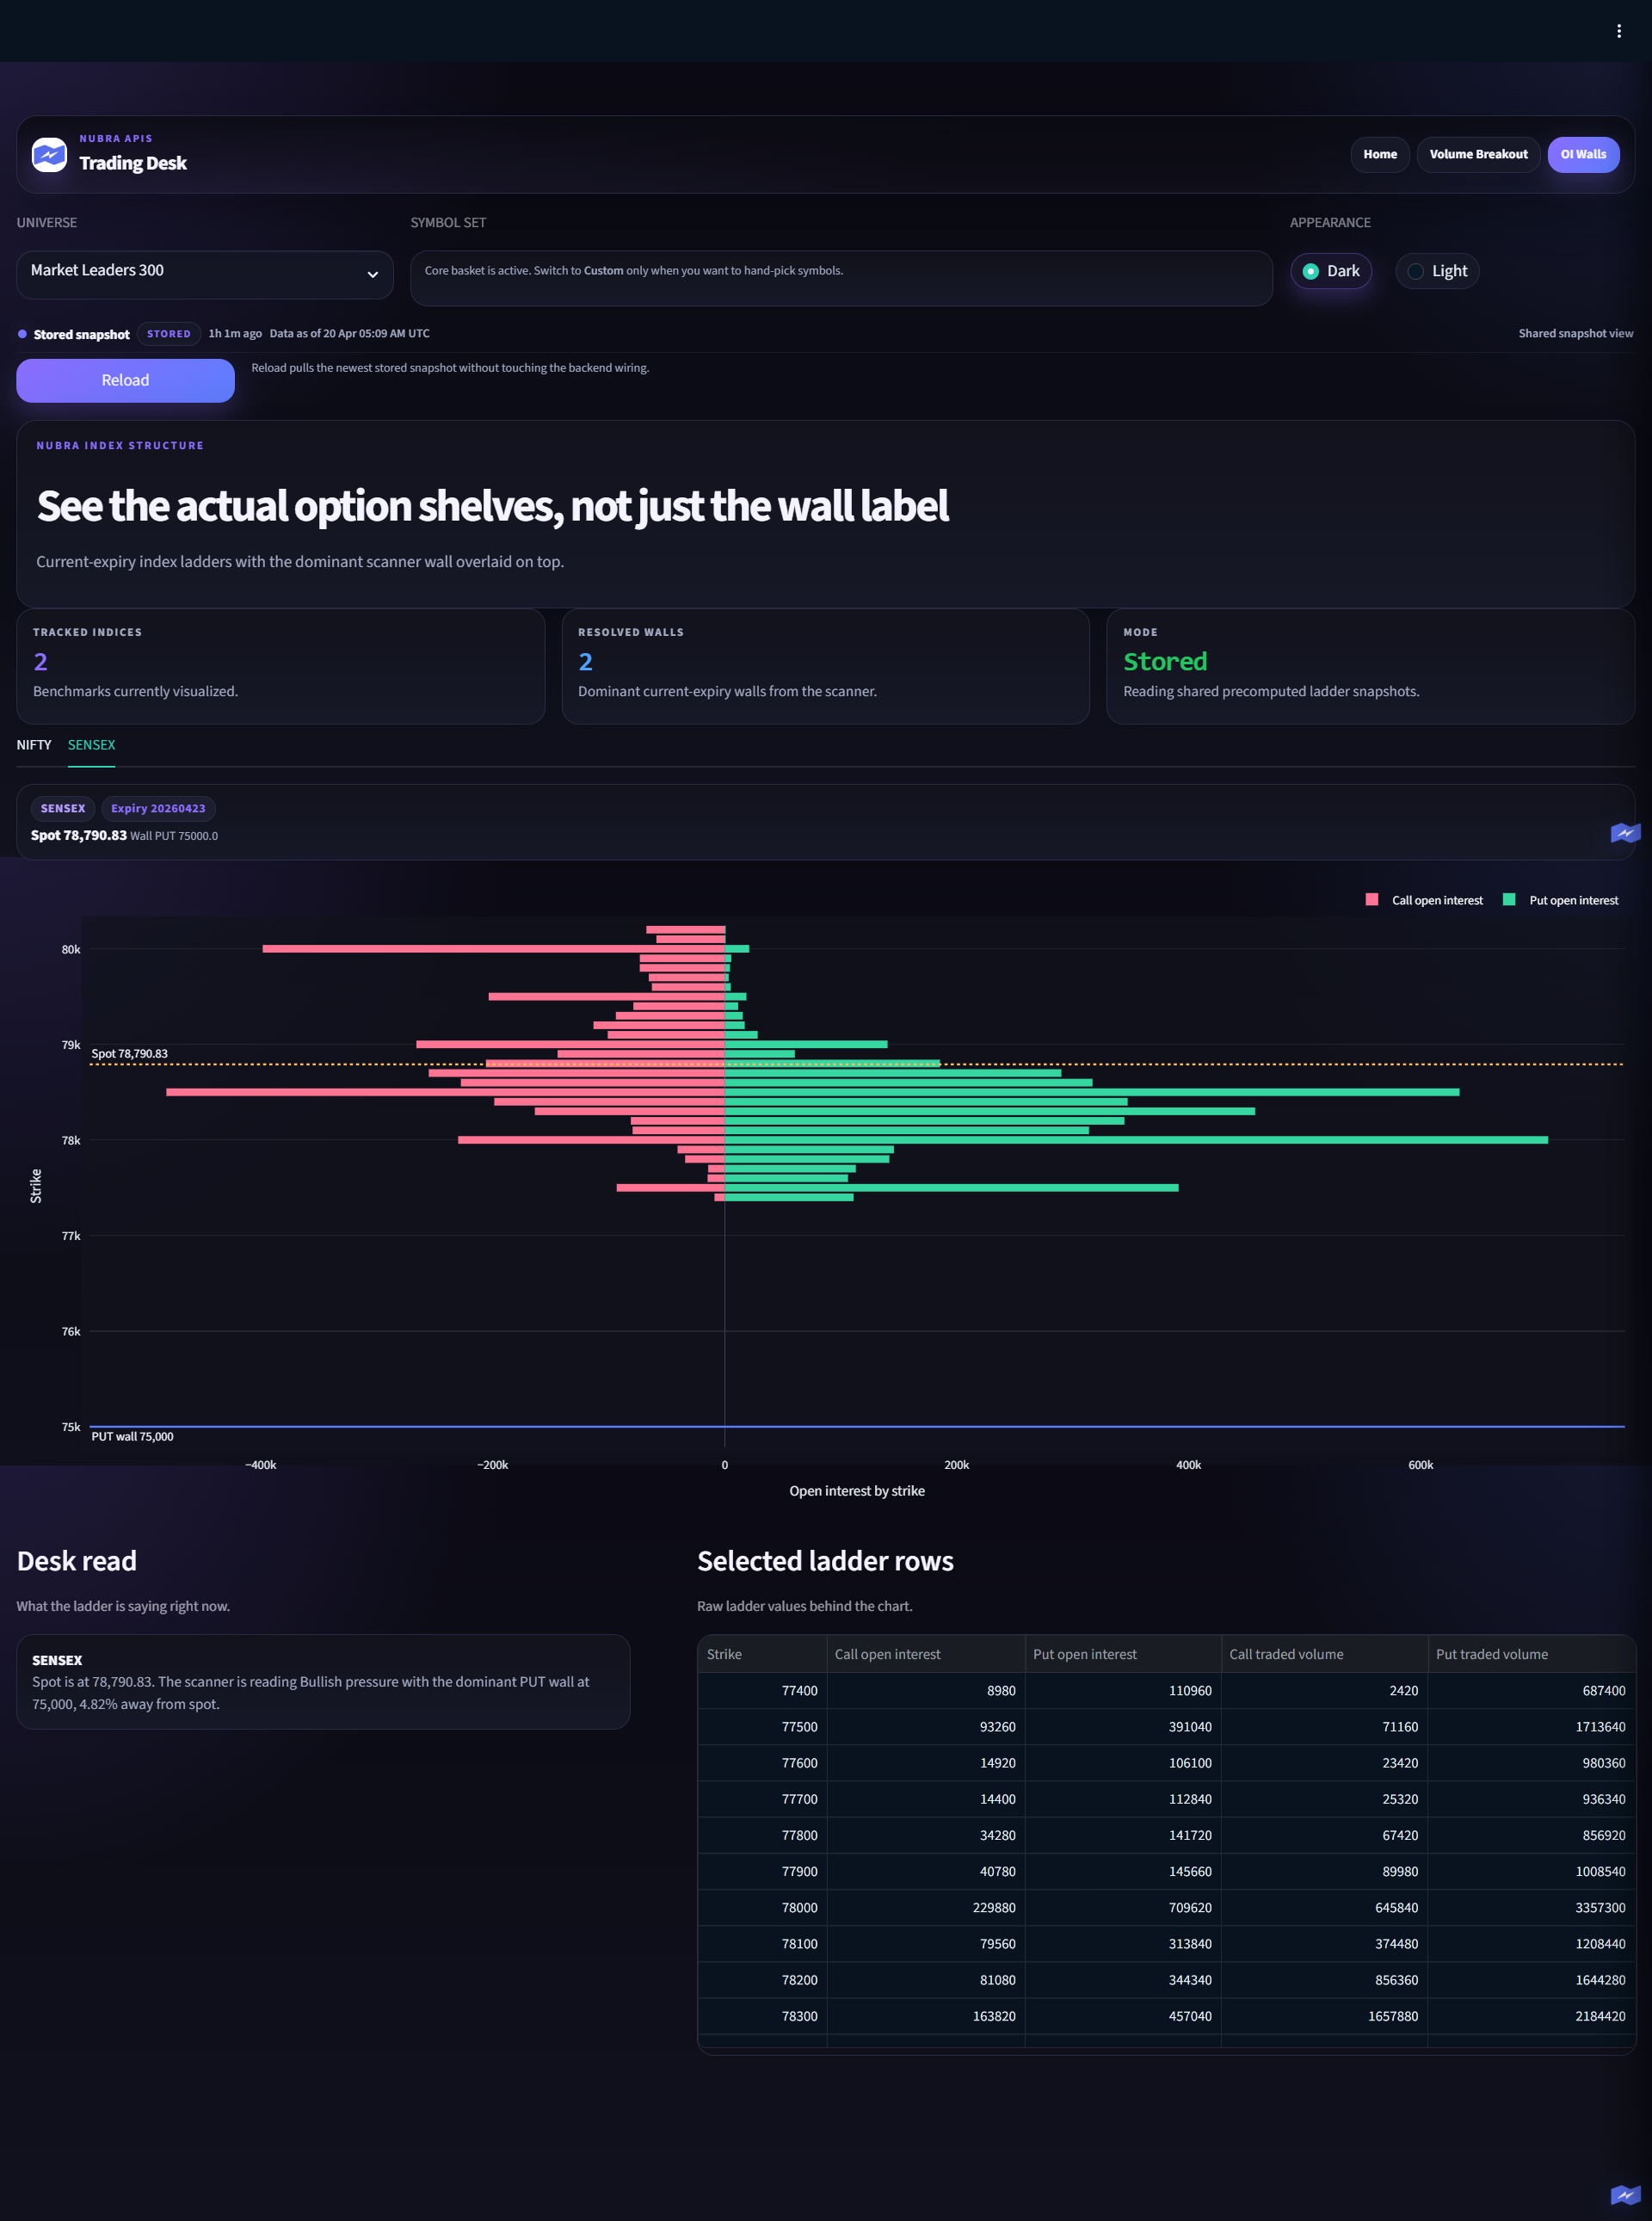
The hosted app does not support a reliable inline embed, so this section uses real dashboard screenshots and a direct link to the live product.
Use the button above to open the full live dashboard experience in a separate tab.
What This Desk Actually Does#
The product is built around three surfaces:
- Home for fast market framing
- Volume Breakout for abnormal participation
- OI Walls for current-expiry options structure
That sounds small. It is supposed to.
The mistake most builders make is treating dashboards like feature collections. A trader does not open a desk because it has twelve widgets. A trader opens a desk to answer one question quickly, then act.
This desk tries to do exactly that.
On one side, it surfaces cash names where volume is abnormal relative to recent behavior. On the other, it shows where open interest is concentrated and what that structure may be saying about pressure around spot.
That is enough to create a useful first read of the market.
Why The Surface Is Narrow#
The most important design decision in this project was not a color choice or a component library.
It was restraint.
We removed anything that diluted the workflow. If a page did not sharpen the market read, it did not belong. If a panel repeated the same idea in a noisier way, it went away.
That left a clearer shape:
- first, identify where participation is unusual
- then, inspect where options structure is concentrated
- then, drill down only where the setup deserves attention
That is a better product pattern than starting with layout and asking what else can be squeezed onto the screen.
The System Under The UI#
This desk is not a notebook dressed up as an application.
The frontend is Streamlit, but Streamlit is only the presentation layer. The real system underneath is split more cleanly:
- Nubra handles authentication and market-data access
- scanner logic ranks and interprets the raw market data
- internal models normalize responses into app-friendly structures
- Supabase stores snapshots and history for fast, stable reads
- scheduled jobs keep the stored state fresh in the background
That separation matters.
Without it, the UI would be tightly coupled to raw API responses and every screen would feel fragile. With it, the dashboard behaves more like a product: the user sees a stable market snapshot while the backend keeps the machinery moving.
The Nubra Surface That Makes It Work#
What makes a desk like this possible is not one single endpoint. It is the combination of a few useful market primitives.
For this build, three mattered most:
- authentication flow to establish a working session
- historical market data to calculate relative-volume baselines
- option-chain data to map strike-level structure, OI, and ladder context
That gives a builder enough raw material to answer both of the desk's core questions.
On top of that, higher-level packages like nubra-volume-breakout and nubra-oi-walls make the build faster by packaging trading-specific logic above the base data layer.
That is an important point for developers.
Nubra can be used in two ways:
- as a raw API and SDK surface when you want full control
- as a faster product-building layer when you want to accelerate common trading workflows
Both are valid. The right choice depends on whether you are optimizing for flexibility or speed.
The Better Way To Build On Nubra#
If you want to build something like this, do not start with components.
Start with a market behavior.
Examples:
- unusual participation
- expiry pressure
- intraday continuation
- sector rotation
- OI concentration
Then work forward in this order:
- Identify the minimum data needed to express that behavior.
- Normalize the responses into your own internal model.
- Store the latest snapshot separately from deeper history.
- Build the UI around one decision, not every field.
That order sounds simple, but it prevents a lot of bad dashboard design.
The frontend should not be the first place meaning gets created. The interpretation layer should already exist before the UI arrives.
What Developers Can Build Next#
Once you think in that pattern, the same Nubra surface can support very different products.
A few obvious extensions are:
- a momentum terminal that ranks acceleration and participation together
- an index options monitor focused on wall drift and strike pressure
- a sector rotation board that compares leadership shifts across baskets
- a pre-open dashboard for gap and opening participation signals
- a research console that moves from historical validation to live monitoring
This is what makes Nubra interesting from a product perspective.
The API is not only useful for retrieving data. It is useful for packaging market structure into tools that traders can actually use.
What This Project Proves#
The strongest thing about this desk is not that it is large.
It is that it is opinionated.
It proves a practical Nubra-powered product can be narrow, fast, and useful without pretending to be a full terminal.
That is the real takeaway:
- a homepage can frame the market through two strong lenses
- a breakout board can make abnormal participation visible immediately
- an options structure board can make index pressure easier to read
That is already enough to show what Nubra APIs can become in the hands of a developer who cares about product shape.
The API is not the finished thing.
The product is the interpretation layer built on top of it.