
Most chart analysis tools do one part of the job well.
They either show the chart, or they explain indicators, or they summarize news, or they help you interact with the market structure already visible on screen.
The problem is that traders usually need all of those at the same time.
That is exactly where the Nubra TradingView Extension becomes useful. It sits beside your live TradingView or Nubra chart, reads the chart context directly, interprets visible indicators and studies, and lets you ask for full technical analysis in plain English. On top of that, it can also run a sentiment workflow using live Indian-market RSS and regulatory feeds so the analysis is not limited to price action alone.
Instead of switching between charts, notes, news tabs, and external AI tools, the workflow stays inside one side panel next to the market.
What the Extension Does#
At a high level, the extension turns a live chart into an AI-assisted analysis workspace.
It can read the active symbol, timeframe, chart type, recent bars, visible indicators, Pine labels, Pine tables, price levels, and chart zones directly from the page. That means the model is not responding in the abstract. It is working from the actual chart you already have open.
This makes a big difference in practice. Instead of typing a generic question like "What do you think about NIFTY?", you can ask the extension for a full analysis of the exact chart in front of you, identify support and resistance, interpret visible indicators, switch timeframes, or blend chart structure with current market sentiment.
Main Capabilities#
The extension is built around five practical capabilities.
First, it reads the live TradingView or Nubra chart context directly, including the current symbol, timeframe, chart state, and recent OHLCV behavior.
Second, it performs full technical analysis by combining price structure, momentum, volatility, volume behavior, and visible studies already attached to the chart.
Third, it can inspect chart objects and Pine outputs such as support and resistance levels, labels, tables, supply and demand zones, and other visually embedded signals that are usually difficult to summarize manually.
Fourth, it adds a technical + sentiment workflow by processing live RSS and regulatory sources for Indian markets, then summarizing overall market mood, confidence, fear/greed balance, themes, macro drivers, and stock or sector-level sentiment where relevant.
Fifth, it can interact with the chart when needed, including changing the symbol, changing the timeframe, switching chart type, adding indicators, or drawing horizontal levels.
The Interface#
The experience is designed to stay simple even though the underlying workflow is powerful.
When the extension opens, the user gets a focused chat-style side panel directly beside the chart.
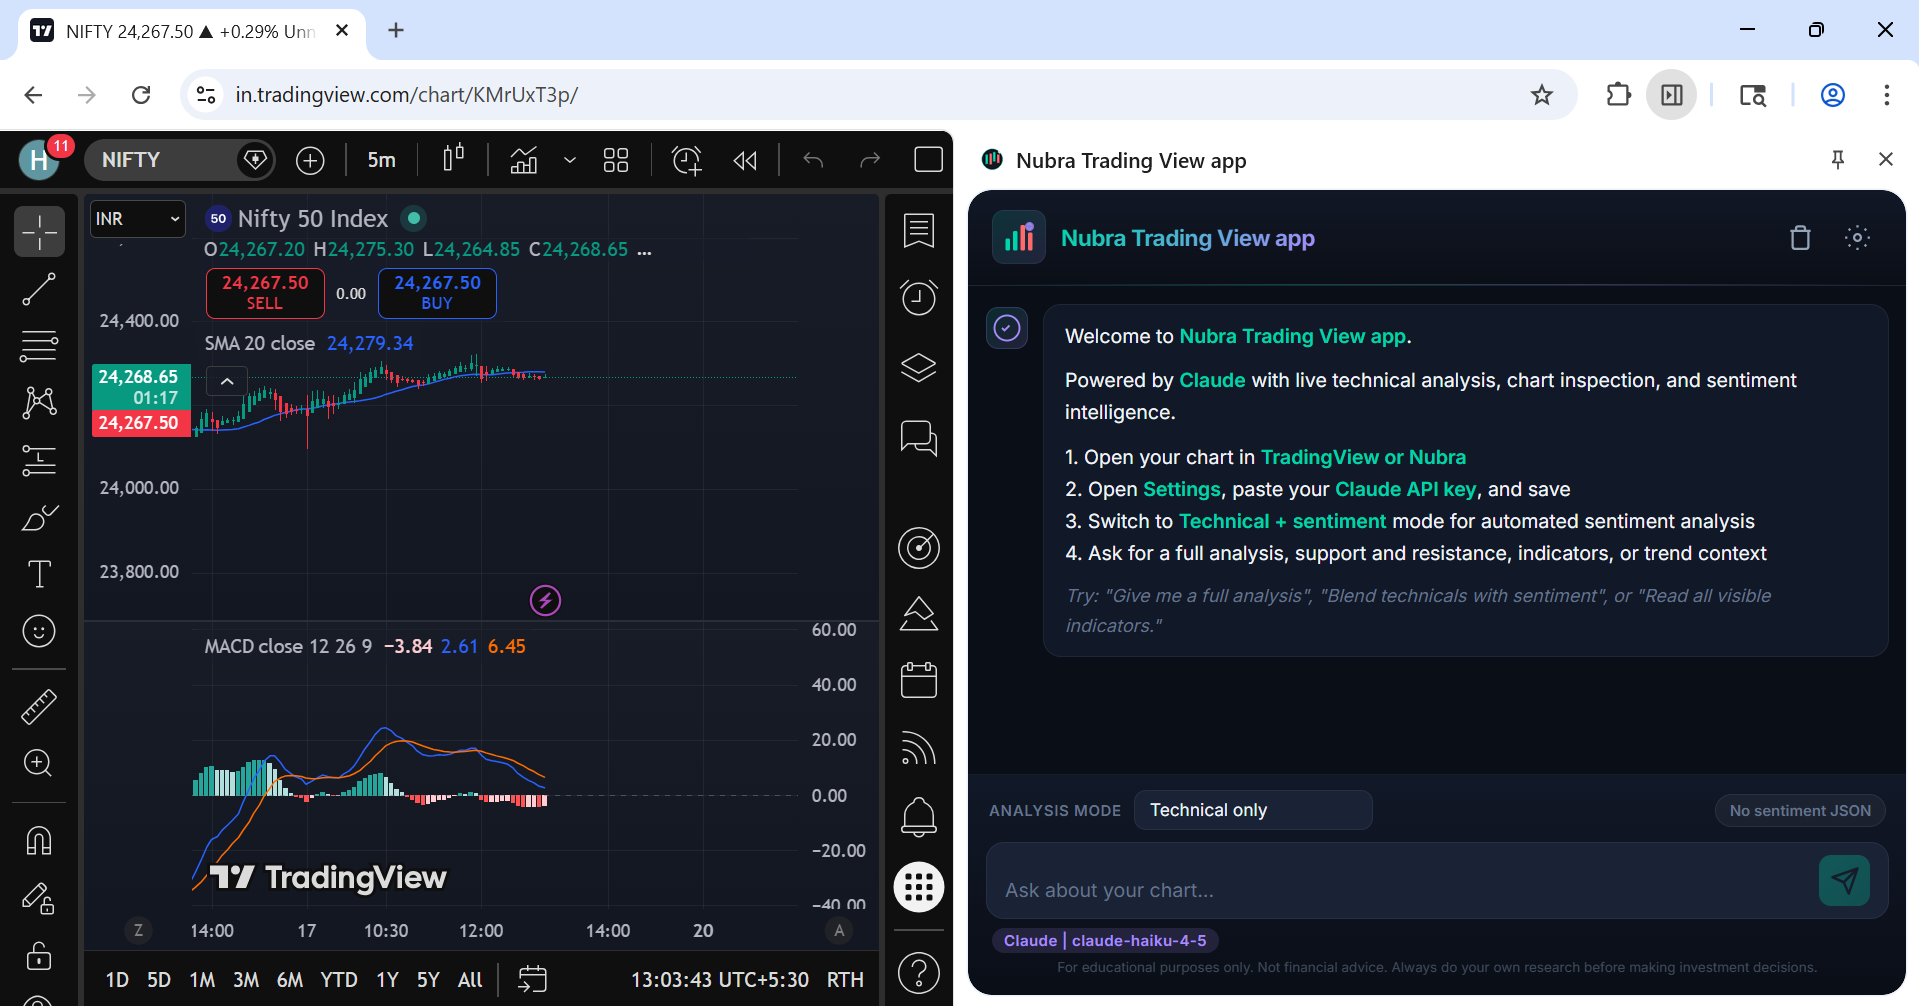
The welcome screen immediately frames the main use cases: full analysis, support and resistance review, indicator interpretation, and sentiment-assisted market reading.
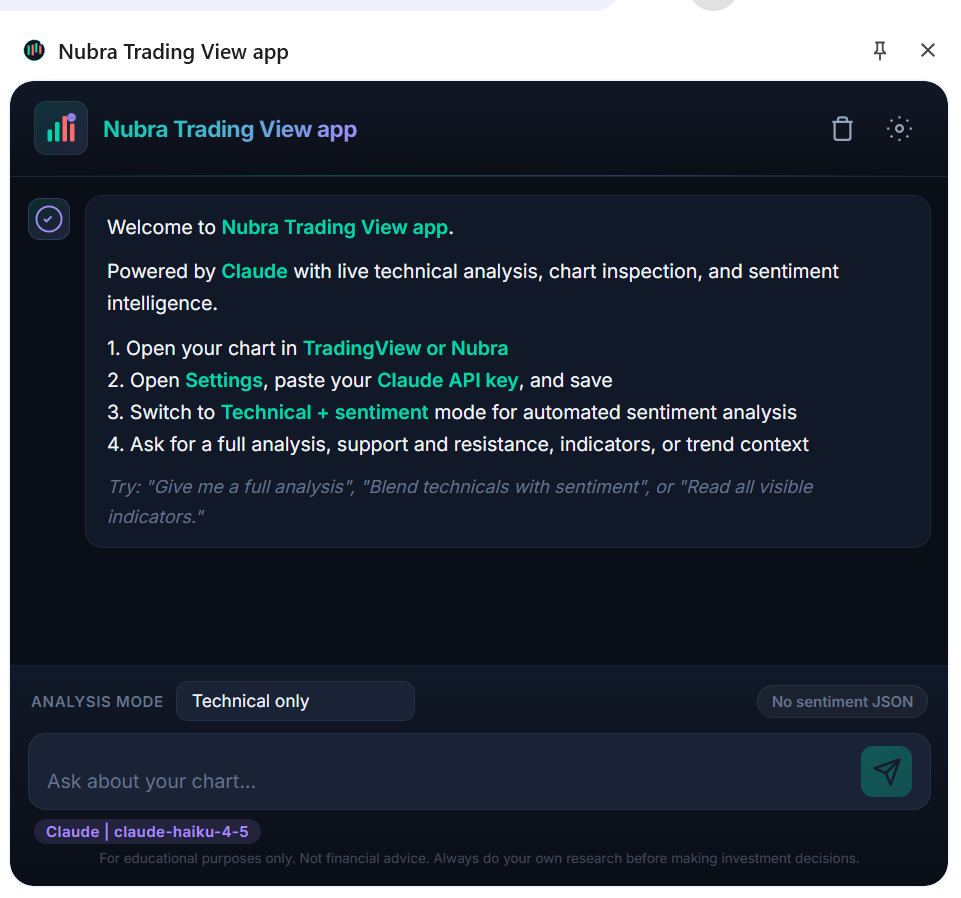
This keeps the entry point easy for traders who may not want to think about tool chains, prompts, or structured workflows. They just open the chart and ask the question.
Settings and Workflow#
The extension uses a straightforward setup flow.
The user opens Settings, pastes their Claude API key, chooses the Claude model, and decides whether to run technical-only analysis or technical + sentiment mode. The settings panel also allows sentiment JSON upload and manual sentiment pipeline execution from live feeds.
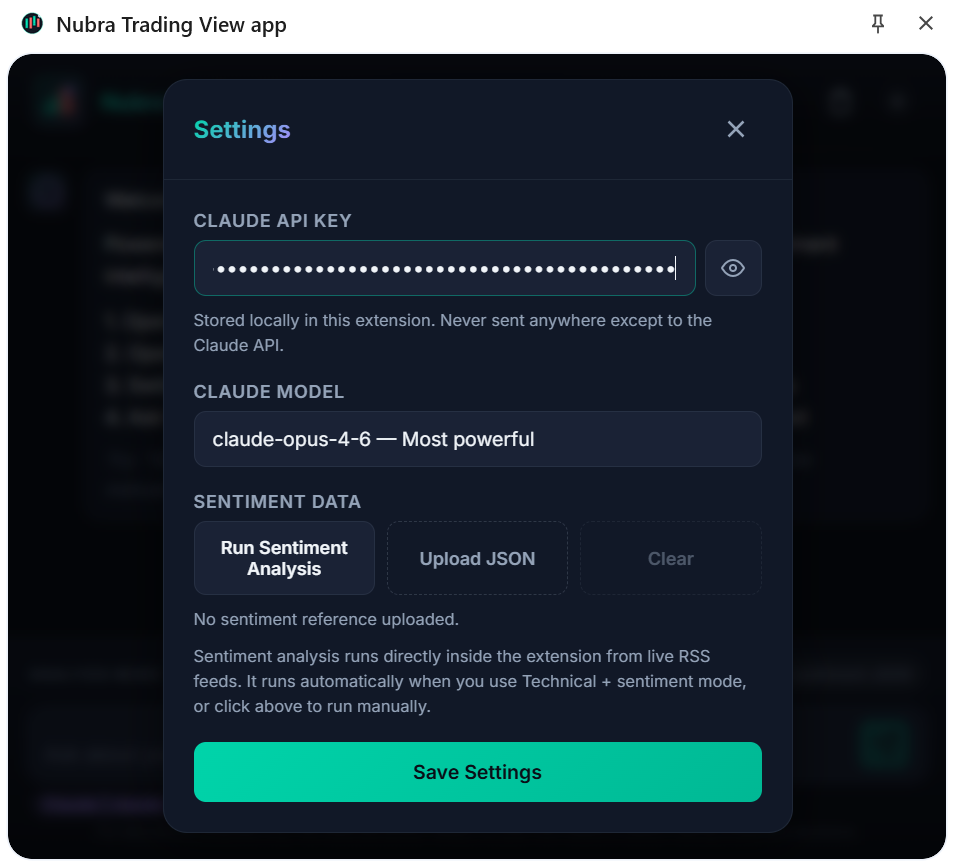
Once configured, the workflow becomes very fast:
- Open a chart in TradingView or Nubra.
- Open the extension side panel.
- Ask for a full chart review, indicator read, support/resistance analysis, or sentiment summary.
- Let the extension inspect the live chart and return a structured answer.
Technical Analysis in Context#
One of the strongest parts of the extension is that it does not stop at simple commentary.
It can actively work with the chart context. For example, it can switch the timeframe to a different resolution, add an indicator like RSI, inspect the updated chart, and then explain what the trend, momentum, and market structure are saying in that new context.
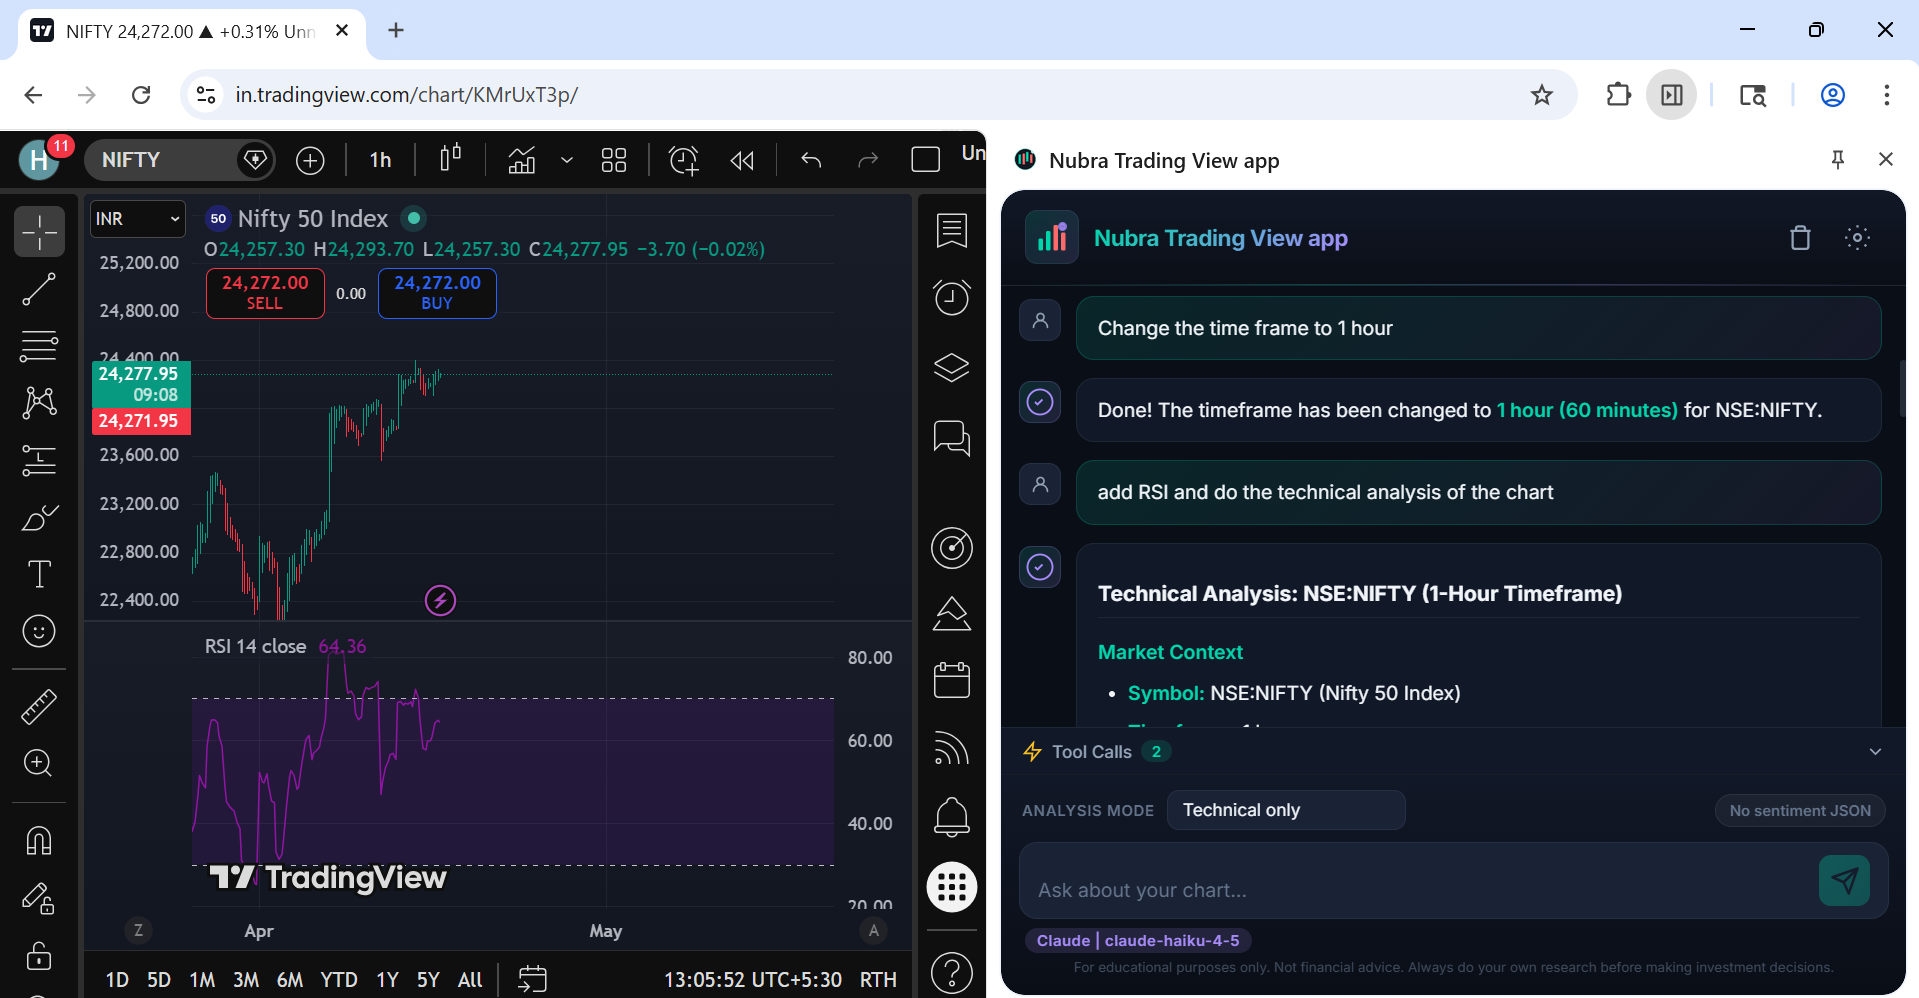
This creates a much more interactive workflow than static chart notes or external chat tools. Instead of manually changing the chart and then trying to explain it yourself, you can ask the assistant to work through that process with you.
Adding Sentiment to the Chart#
The extension is also built to go beyond price-only analysis.
In Technical + sentiment mode, it can run a live sentiment pipeline that processes Indian-market RSS and regulatory sources, scores sentiment, and presents a structured market summary with confidence, regime, narrative, and supporting evidence.
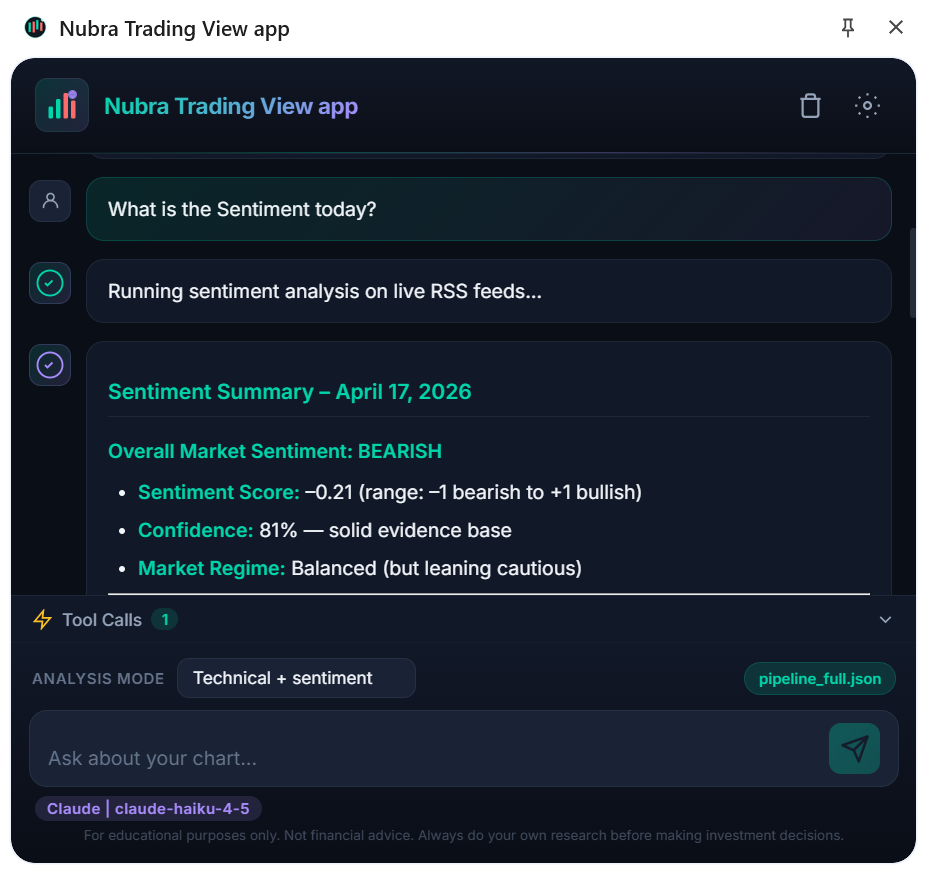
This is useful because many market moves are not explained well by indicators alone. Sometimes the chart looks constructive while news flow is turning cautious, or sentiment is improving before the price fully reflects it. By bringing both together in one interface, the extension helps traders spot that divergence earlier.
Demo Video#
If you want to show the full workflow, the demo video can be embedded directly in the post:
This works best as a walkthrough of the end-to-end flow: opening a chart, configuring Claude, asking for a technical review, switching into sentiment mode, and watching the side panel produce structured analysis beside the live TradingView canvas.
Why This Matters#
The value of this extension is not just that it adds AI to a chart.
The real value is that it gives the model direct access to the live chart context that traders are already using. That reduces guesswork, makes responses more specific, and allows the analysis to stay grounded in the actual visible market structure instead of generic market opinions.
For an active trader or analyst, this means less context switching, faster interpretation, and a much tighter loop between chart observation, indicator reading, and news-aware decision support.
Final Thoughts#
The Nubra TradingView Extension is a strong example of what AI becomes when it is connected to the real working surface of a trader.
It does not replace the chart. It makes the chart more explainable, more interactive, and more useful.
By combining live technical analysis, chart-object extraction, indicator interpretation, chart control, and sentiment intelligence in one side panel, the extension creates a workflow that feels far closer to a research assistant than a basic chatbot.
For traders who already live inside TradingView, that is the real upgrade: the analysis happens where the market is already being watched.