
Most indicator stacks tell you many things at once, but they rarely tell you how to combine them.
One signal looks bullish, another looks neutral, a third looks weakly bearish, and by the time you finish scanning everything, you are still left making the same judgment call manually.
That is exactly the problem smart-money-heatmap is trying to solve.
Available on PyPI, the package scores NSE instruments across eight Smart Money Concepts signals and then compresses them into a single aggregate conviction score: bullish, bearish, or neutral. It is built on top of the Nubra Python SDK, pulls live market context, and gives you both the top-level score and the full reasoning behind it.
If you already work with structure-based trading ideas like BOS, CHoCH, order blocks, fair value gaps, VWAP positioning, or OI walls, this library gives you a much more systematic way to rank instruments instead of reading each setup one by one.
Why a Heatmap Is Useful#
Smart Money Concepts are powerful partly because they are contextual.
A bullish fair value gap by itself does not always mean much. A bullish order block by itself does not always mean much either. But when structure, displacement, liquidity, and positioning start pointing in the same direction, the quality of the setup changes.
That is where a scoring heatmap becomes useful.
Instead of treating each signal as an isolated opinion, smart-money-heatmap treats them as inputs into one structured decision layer. The package evaluates the signals, checks for conflict, adjusts for liquidity, and then returns a score you can actually use to compare names.
That is a much better workflow when you are screening multiple instruments and trying to decide where the cleanest structure is forming.
What the Library Measures#
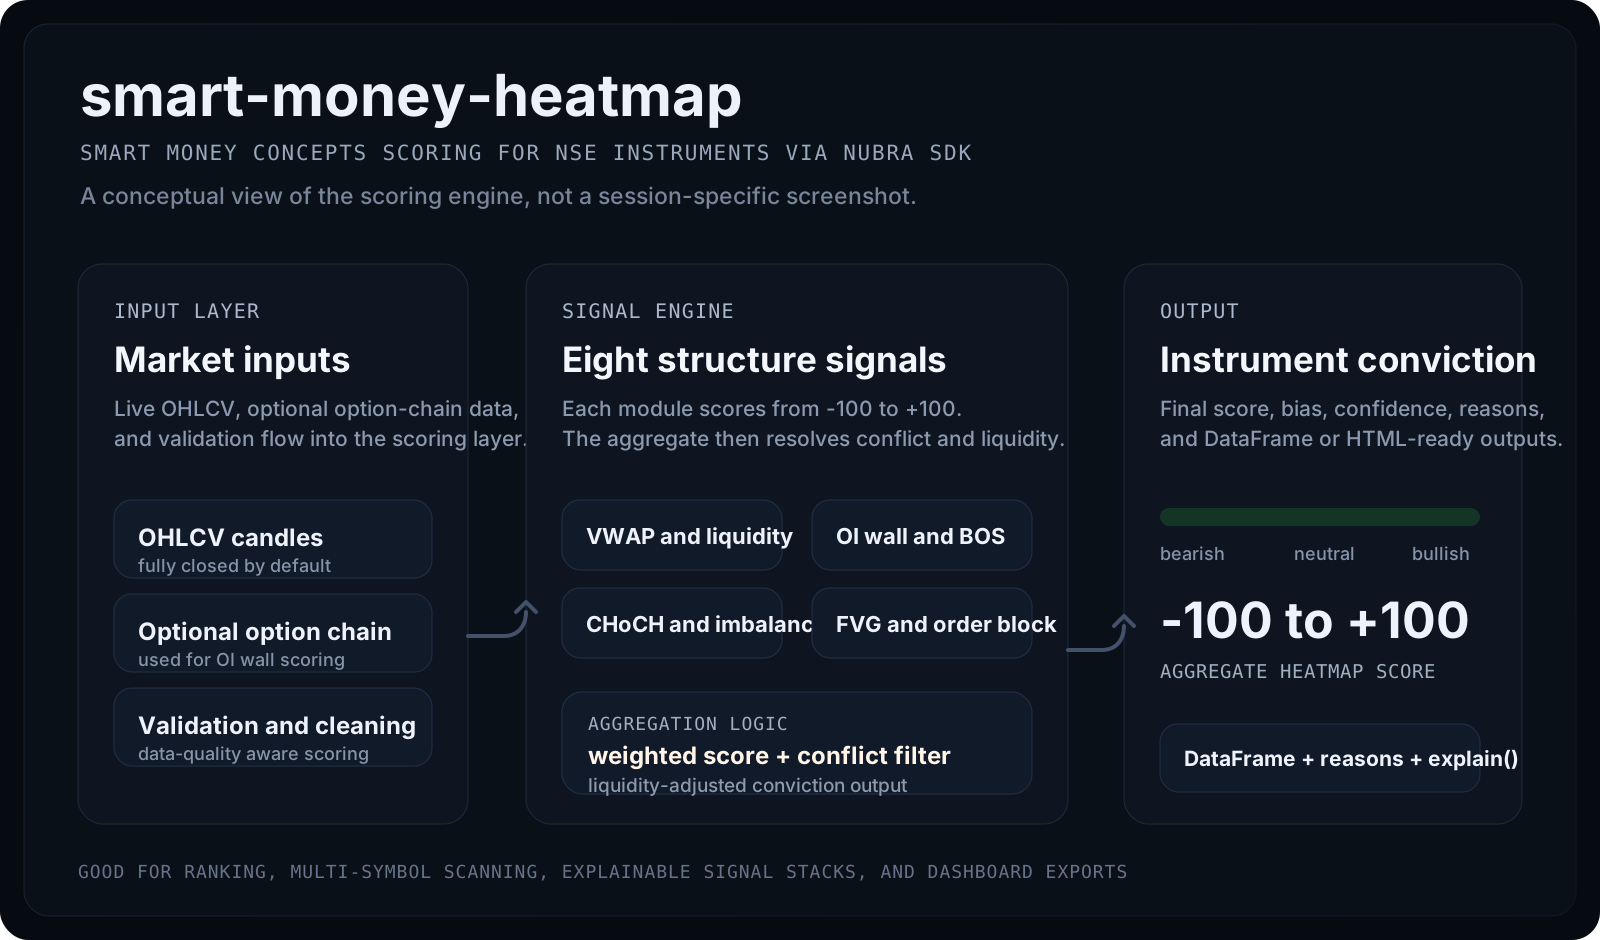
At a high level, the package analyzes every instrument you pass in across these eight signals:
- VWAP deviation
- OI wall proximity
- Break of Structure, or BOS
- Change of Character, or CHoCH
- imbalance or displacement
- Fair Value Gap, or FVG
- order block
- liquidity
Each signal contributes a score on a minus-100 to plus-100 scale. Those are not all treated equally. In the current implementation, the default aggregate weights give OI wall the highest influence, with imbalance and order block also carrying a heavier contribution than the rest.
That weighting choice is worth noticing because it means the library is not simply averaging everything blindly. It is expressing an opinion about which signals should matter more in the final conviction score.
The other important detail is that the aggregate logic is not just weighted averaging. It also penalizes inter-signal conflict and scales the result with a liquidity confidence factor, which helps keep the final score more realistic when the market picture is mixed.
The Visual Overview#
The visual below is a much closer representation of how the idea feels in practice. Instead of an abstract system diagram, it shows the Smart Money Concepts dashboard view itself: live structure zones on the left, the working chart in the middle, and the scanner output on the right.
Why the Design Works Well#
One of the best parts of smart-money-heatmap is that it keeps the Nubra integration and the scoring logic separate.
You authenticate with the Nubra SDK yourself, pass the authenticated client into the heatmap engine, and let the package handle the analysis layer. That keeps the library focused on what it should do: fetch what it needs, evaluate structure, and return interpretable results.
The compute flow also makes a thoughtful default choice that matters in real usage. Candle-based signals use fully closed candles by default, while forming-candle behavior is available only if you explicitly opt into it. That helps avoid noisy structure reads when someone wants a more stable heatmap.
There is also a practical toggle for speed and stability. If you want to skip the option-chain dependency and build a candle-only heatmap, the package supports that mode too, which removes the OI wall signal from the live fetch path.
These are small design choices, but they make the package much easier to trust in live workflows.
Installation#
Install the package from PyPI.
Based on the current PyPI release and the local package metadata, smart-money-heatmap is on version 0.2.0, requires Python 3.9+, depends on pandas 1.5 or newer, and also exposes a command-line entry point.
Using It with the Nubra SDK#
The basic workflow is intentionally straightforward.
You authenticate with Nubra, create the heatmap object, and then run the scoring flow against the symbols you want to monitor. In practice, that means logging in, selecting the instrument list and timeframe, and letting the engine score the full basket in one pass.
There is also a command-line flow if you prefer to run quick scans straight from the terminal.
That makes the package useful whether you want to plug it into a Python workflow or simply run quick structure scans from the terminal.
What You Get Back#
This is where the library becomes more than just a scoring script.
The immediate output is a heatmap of signal scores per instrument, but the result object carries much more than that. It includes helpers for turning the output into tables, status views, reason summaries, rankings, symbol-level explanations, and HTML-ready output.
That means you can use it in several ways:
- rank instruments by aggregate score
- inspect which signals were valid, neutral, mixed, or unavailable
- export the grid to notebooks or dashboards
- drill into the full explanation for a single symbol
The explanation layer is especially strong. For each symbol, the package returns signal-level reasoning, data-quality status, aggregate bias, confidence, bullish reasons, bearish reasons, neutral or missing reasons, and a debug section showing how the final score was adjusted.
That is a big step up from a black-box ranking number.
Why the Aggregation Layer Matters#
The real advantage of smart-money-heatmap is not that it computes eight signals.
Plenty of people can compute eight signals.
The useful part is that it gives you a decision layer on top of them. The aggregate score is conflict-aware, liquidity-adjusted, and designed to surface whether the overall picture is strongly aligned, mixed, or weak.
That becomes especially valuable when you are screening multiple names. Instead of asking, "Does this one have a BOS?" or "Does this one have an order block?", you can ask a better question:
Which instrument has the cleanest overall structural alignment right now?
That is exactly the type of question a good heatmap should answer.
Why This Library Is Useful#
What makes smart-money-heatmap compelling is that it packages a broad Smart Money Concepts workflow into something that is still programmable and inspectable.
It does not force you into a UI. It does not hide the reasoning. And it does not reduce everything to a single number without context. It gives you both the ranking view and the explanation view, which is the right combination for traders and developers alike.
For discretionary traders, it can act like a fast structure scanner. For systematic users, it can become a ranking layer, a filter, or an alerting input inside a larger trading pipeline.
That flexibility is what makes the package feel more like infrastructure than just a demo script.
Final Thoughts#
smart-money-heatmap is useful because it turns a messy multi-signal process into a structured workflow.
Instead of juggling BOS, CHoCH, FVG, order blocks, liquidity, and OI walls separately, you get a consistent way to score them, combine them, and explain them.
If you already build with the Nubra SDK and you want a better way to rank structure-driven setups across symbols, this library is a very solid starting point.