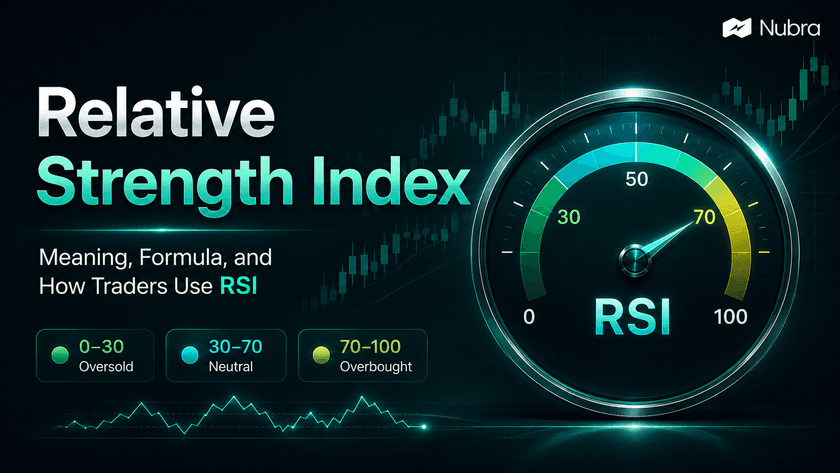
What is the Relative Strength Index? The Relative Strength Index, or RSI, is a momentum indicator used in technical analysis. It measures the speed and size of recent price movements and converts that momentum into a value between 0 and 100. For traders, RSI is useful because it gives a quick read on whether price…
What is the Relative Strength Index?
The Relative Strength Index, or RSI, is a momentum indicator used in technical analysis. It measures the speed and size of recent price movements and converts that momentum into a value between 0 and 100.
For traders, RSI is useful because it gives a quick read on whether price momentum has become stretched in one direction. A high RSI suggests strong recent upward momentum. A low RSI suggests strong recent downward momentum. The important word is momentum. RSI does not tell us what a stock, index, or F&O instrument must do next. It helps us judge whether the latest move may be extended, weakening, or still supported by the broader trend.
RSI was developed by J. Welles Wilder Jr. and is commonly plotted below the price chart. Most charting platforms use a 14-period RSI by default. On a daily chart, that usually means 14 trading days. On an intraday chart, it means 14 candles of the selected timeframe.
In Indian markets, traders often use RSI while tracking stocks, Nifty, Bank Nifty, sector indices, futures, and options-linked setups. The indicator can help frame questions such as: Is momentum still strong? Has a pullback become too sharp? Is price making a new high while momentum is slowing? Is a breakout supported by follow-through, or is it happening after an already stretched move?
Those questions are more useful than treating RSI as a direct buy or sell button.
How RSI works
RSI compares average gains with average losses over a chosen lookback period. If recent gains are larger and more frequent than recent losses, RSI moves higher. If recent losses dominate, RSI moves lower.
The indicator moves within a fixed 0 to 100 scale, which makes it easier to compare momentum across different charts. A stock trading at Rs 150 and an index trading at 25,000 can both have an RSI reading of 65, even though their prices are completely different. RSI normalizes the recent price movement into a common momentum scale.
A reading near 50 usually shows balanced momentum. Readings above 50 suggest upward momentum is stronger than downward momentum over the lookback period. Readings below 50 suggest downward momentum is stronger.
This is why the middle zone matters. Traders often focus only on 70 and 30, but the 50 level can help identify whether momentum is leaning bullish, bearish, or neutral. When RSI repeatedly holds above 50 during pullbacks, the underlying trend may still have strength. When it struggles to move above 50 during rebounds, the market may still be under pressure.
RSI formula
The standard RSI formula is:
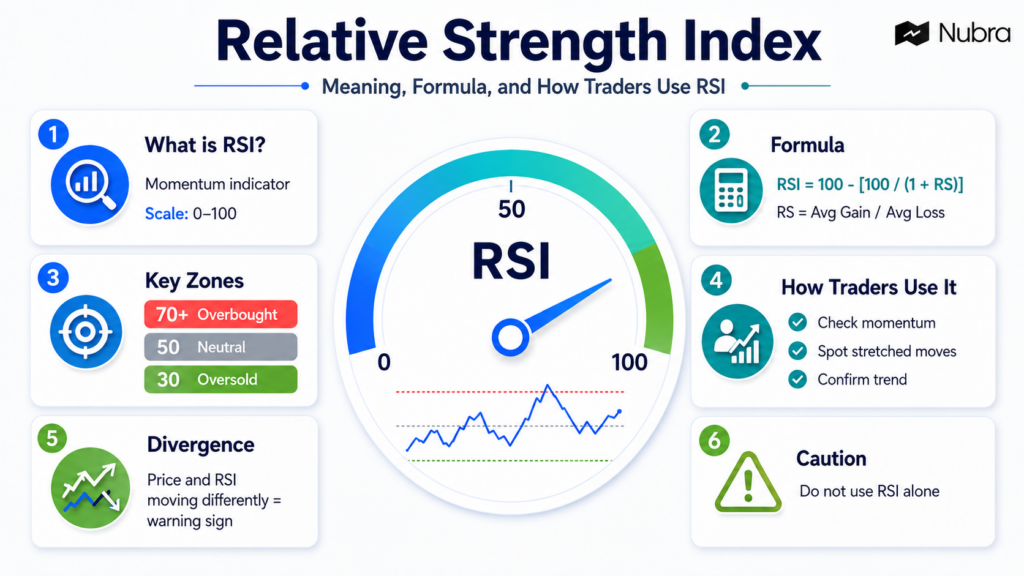
RSI = 100 – [100 / (1 + RS)]
RS stands for Relative Strength:
RS = Average Gain / Average Loss
The usual default period is 14. To calculate the first 14-period RSI, we look at the price changes over 14 periods, separate the gains from the losses, calculate the average gain and average loss, and then apply the formula.
For a simplified example, assume a stock closed higher on several days and the average gain over the period was 1.2%. Assume its average loss was 0.8%. The RS would be:
RS = 1.2 / 0.8 = 1.5
The RSI would be:
RSI = 100 – [100 / (1 + 1.5)] RSI = 100 – [100 / 2.5] RSI = 60
An RSI of 60 means recent gains have been stronger than recent losses over the selected period. It does not mean the price must continue rising. It simply shows that momentum is leaning upward in that lookback window.
After the first calculation, RSI is usually smoothed so the line does not jump too sharply with every new candle. Charting platforms handle this automatically, so traders rarely need to calculate RSI manually. Still, understanding the formula helps us avoid a common trap: RSI is based on past price changes. It is not a forecast engine.
How to read RSI values
RSI is usually interpreted in zones:
| RSI Range | Common Interpretation | Practical Reading |
|---|---|---|
| 70 to 100 | Overbought zone | Recent upward momentum may be stretched |
| 50 to 70 | Positive momentum zone | Buyers have had more control in the lookback period |
| Around 50 | Neutral zone | Momentum is balanced |
| 30 to 50 | Negative momentum zone | Sellers have had more control in the lookback period |
| 0 to 30 | Oversold zone | Recent downward momentum may be stretched |
The traditional view is that RSI above 70 is overbought and RSI below 30 is oversold. These levels are helpful, but they need context.
Overbought does not automatically mean bearish. A stock can stay overbought during a strong rally because buyers continue to absorb supply. Oversold does not automatically mean bullish. A weak stock can remain oversold while sellers keep pressing the trend lower.
This is especially important in index and F&O trading. During a strong Bank Nifty move, RSI may stay above 70 for multiple candles. Shorting only because RSI is high can become expensive if price keeps trending. During a sharp selloff, buying only because RSI is below 30 can expose the trader to continued downside.
The better question is: what is RSI saying in relation to price structure, volume, trend, and market context?
Overbought and oversold RSI levels
An RSI above 70 usually means the instrument has moved up quickly compared with its recent average losses. Traders may watch this zone for exhaustion, profit booking, or a possible pause. But a high RSI can also confirm strong momentum when price is breaking out of a range with volume.
An RSI below 30 usually means the instrument has moved down quickly compared with its recent average gains. Traders may watch this zone for a bounce, short covering, or a pause in selling. But a low RSI can also confirm bearish pressure during a breakdown.
For active trading, the level alone is rarely enough. A practical RSI read usually combines:
- the prevailing trend;
- support and resistance;
- candle structure near the RSI signal;
- volume or participation;
- broader index direction;
- for F&O, option-chain signals such as open interest shifts, strike buildup, and expiry context.
If Nifty is in a clear uptrend and RSI cools from 72 to 52 while price holds above a key moving average, that may show a healthy pullback rather than a trend reversal. If RSI crosses below 50 while price breaks a support zone with rising volume, the same indicator becomes more cautionary.
RSI in trending and range-bound markets
RSI tends to be cleaner in range-bound markets because price is already moving between support and resistance zones. In that environment, high RSI near resistance can warn that upside momentum may be stretched, while low RSI near support can show that downside momentum may be stretched.
Trending markets behave differently. In strong uptrends, RSI may move between 40 and 80 instead of 30 and 70. The 40 to 50 zone can act like momentum support. In strong downtrends, RSI may move between 20 and 60, with the 50 to 60 zone acting like resistance.
This range-shift idea matters because it keeps us from using the same rigid reading in every market condition. A pullback to RSI 42 may be weak in a sideways market, but it may be normal in a strong uptrend. A rally to RSI 58 may look positive in isolation, but in a downtrend it may simply be a lower-high zone where sellers return.
Before acting on RSI, it helps to mark the trend first. Is price making higher highs and higher lows? Is it below a major moving average? Is the index leading or dragging the stock? Is the option chain showing support or resistance buildup near the price zone being tested? RSI becomes more useful when these questions are answered together.
RSI divergence
RSI divergence appears when price and RSI move in different directions. It is popular because it can show that momentum is changing before price confirms the change.
A bullish divergence happens when price makes a lower low, but RSI makes a higher low. This suggests selling pressure may be losing strength. A bearish divergence happens when price makes a higher high, but RSI makes a lower high. This suggests buying momentum may be weakening.
Divergence can be useful, but it is often misunderstood. It does not guarantee a reversal. In a strong trend, divergence can appear more than once before price actually turns. A stock may keep making higher highs even while RSI forms lower highs. An index may keep sliding even while RSI forms higher lows.
The cleaner use is to treat divergence as a warning signal, not a standalone entry. If bearish divergence appears near resistance and price then breaks a short-term support line, the signal has more context. If bullish divergence appears near a demand zone and price reclaims a moving average, the setup becomes more structured.
For intraday traders, divergence also depends heavily on timeframe. A five-minute RSI divergence may only produce a small pullback inside a larger bullish day. A daily divergence can matter more for swing traders, but it may take longer to play out.
RSI swing rejection
RSI swing rejection is another way traders study momentum shifts. It focuses on the RSI line itself rather than price.
In a bullish swing rejection, RSI drops below 30, moves back above 30, forms a higher low while staying above 30, and then breaks its recent RSI high. The idea is that selling momentum weakened after entering the oversold zone.
In a bearish swing rejection, RSI rises above 70, falls back below 70, forms a lower high while staying below 70, and then breaks its recent RSI low. The idea is that buying momentum weakened after entering the overbought zone.
Like divergence, swing rejection works better when it aligns with price structure. A bullish swing rejection near a well-defined support zone is more meaningful than one appearing in the middle of a noisy chart. A bearish swing rejection near resistance carries more weight when price also fails to hold a breakout.
Using RSI with other indicators
RSI becomes more practical when it is part of a checklist. Since it measures momentum, it should be paired with tools that answer different questions.
Moving averages help define trend direction. If price is above a rising moving average and RSI holds above 50, the trend context may still be positive. If price is below a falling moving average and RSI fails near 50 or 60, the bounce may be weak.
Support and resistance help locate where RSI signals matter. An oversold reading near no visible support is less useful than an oversold reading near a prior demand zone. An overbought reading during a breakout is different from an overbought reading directly under resistance.
Volume can help confirm participation. A breakout with rising volume and RSI above 60 may show stronger participation than a breakout where RSI is high but volume is fading.
For options and F&O traders, RSI can also be read alongside option-chain and open interest data. If price approaches resistance, RSI is stretched, and call open interest is building at nearby strikes, the chart may deserve more caution. If price breaks out, RSI holds momentum, and open interest shifts support the move, the signal has more context. This does not guarantee the trade outcome, but it gives a more complete view than RSI alone.
RSI vs MACD
RSI and MACD are both momentum indicators, but they measure momentum differently.
RSI compares recent average gains with recent average losses and converts that relationship into a bounded 0 to 100 reading. MACD compares moving averages, typically the 12-period and 26-period exponential moving averages, and then uses a signal line to track changes in trend momentum.
| Point of Difference | RSI | MACD |
|---|---|---|
| Main use | Measures momentum strength and stretched conditions | Tracks moving-average momentum and trend shifts |
| Scale | Bounded between 0 and 100 | Not bounded to a fixed range |
| Common signals | 70/30 levels, 50 line, divergence, swing rejection | MACD line, signal-line crossover, histogram, divergence |
| Works well for | Reading overbought/oversold conditions and momentum shifts | Reading trend-following momentum and crossover behavior |
| Risk | Can stay overbought or oversold in strong trends | Can lag in fast-moving markets |
The two indicators can disagree. RSI may be above 70 while MACD still shows rising momentum. That does not make either indicator wrong. It means they are measuring different parts of the move. In practice, traders use this disagreement to slow down and review the chart more carefully.
Choosing RSI settings
The 14-period RSI is the standard default because it balances responsiveness and smoothness. Shorter settings, such as 7 or 9 periods, react faster but produce more noise. Longer settings, such as 21 or 30 periods, react more slowly and may suit broader swing or position analysis.
Intraday traders may prefer a faster RSI, but faster signals can also create more false triggers. Swing traders may prefer the default or a slightly longer period to reduce noise. The right setting depends on the timeframe, instrument, and trading plan.
The overbought and oversold levels can also be adjusted. Some traders use 80/20 in strong markets to reduce premature signals. Others use 60/40 to study trend shifts. The key is consistency. Changing settings after every losing trade makes the indicator harder to evaluate.
Limitations of RSI
RSI is useful, but it has clear limitations. It is based on historical price movement, so it cannot predict future price with certainty. It can remain overbought or oversold for long periods in strong trends. Divergence can appear too early. Shorter RSI settings can create noisy signals. A single RSI value can look very different depending on the timeframe.
This is why RSI should not be used as a standalone decision tool. It works best when it supports a broader trading process: define the trend, mark key levels, check volatility, review participation, size risk carefully, and avoid treating any indicator as a guarantee.
For Indian market participants, risk also changes around events such as results, policy announcements, global market moves, weekly expiry, and sudden changes in index breadth. An RSI reading taken before a major event may lose relevance quickly after the event.
How RSI fits into a Nubra trading workflow
RSI is most useful when it helps traders organize chart reading, not when it replaces judgment. A structured workflow may start with the broader index trend, move into the stock or F&O instrument, check RSI for momentum, compare the signal with price levels, and then review option-chain or open-interest context where relevant.
Nubra can support this kind of disciplined analysis by keeping the focus on trading workflows rather than isolated signals. A trader studying a Nifty or Bank Nifty setup can use RSI as one input alongside charts, strategy planning, risk checks, and market context. The goal is not to prove that RSI is right. The goal is to understand whether momentum supports the trade idea, contradicts it, or asks for more confirmation.
Trading involves market risk, and outcomes depend on market conditions, execution, and user decisions. This guide is for educational purposes and should not be treated as investment advice.
FAQs
What does RSI mean in trading?
RSI means Relative Strength Index. It is a technical indicator that measures recent price momentum on a scale from 0 to 100. Traders use it to study whether momentum is strong, weak, overbought, oversold, or diverging from price.
What is the best RSI setting?
The default RSI setting is 14 periods. It is widely used because it balances speed and smoothness. Shorter periods react faster but can create more noise. Longer periods react more slowly and may suit broader trend analysis.
Is RSI above 70 always a sell signal?
No. RSI above 70 shows strong upward momentum and possible overbought conditions, but price can stay overbought during strong trends. It should be checked with trend, support and resistance, volume, and broader market context.
Is RSI below 30 always a buy signal?
No. RSI below 30 shows strong downward momentum and possible oversold conditions, but price can remain oversold during a strong downtrend. A trader should wait for additional confirmation instead of acting only on the RSI value.
What does RSI 50 mean?
RSI around 50 shows a balance between recent gains and losses. Above 50, momentum leans positive. Below 50, momentum leans negative. The 50 level is often useful for reading trend strength.
What is RSI divergence?
RSI divergence occurs when price and RSI move differently. Bullish divergence appears when price makes a lower low while RSI makes a higher low. Bearish divergence appears when price makes a higher high while RSI makes a lower high.
Is RSI the same as relative strength?
No. RSI is the Relative Strength Index, a momentum oscillator for one instrument’s recent price movement. Relative strength usually compares one instrument’s performance against another instrument, index, or benchmark.
Can RSI be used for options trading?
RSI can be used while analysing the underlying stock or index for an options setup, but it should not be used alone. Options traders usually need to consider price trend, volatility, expiry, strike selection, open interest, liquidity, and risk.
Which is better, RSI or MACD?
Neither is universally better. RSI is a bounded momentum oscillator that helps identify stretched conditions and momentum shifts. MACD is a moving-average-based momentum indicator that helps study trend changes. Many traders use both for different parts of analysis.
Disclaimer: The information provided in this blog is for educational and informational purposes only and should not be construed as investment advice, financial advice, or a recommendation to buy, sell, or hold any securities or financial products. Investments in the securities market are subject to market risks. Please read all related documents carefully before investing. Readers should conduct their own research and consult a SEBI-registered investment adviser or other qualified financial professional before making any investment decisions. Past performance is not indicative of future results.