Nubra Blogs
The Ultimate Guide to Options Trading
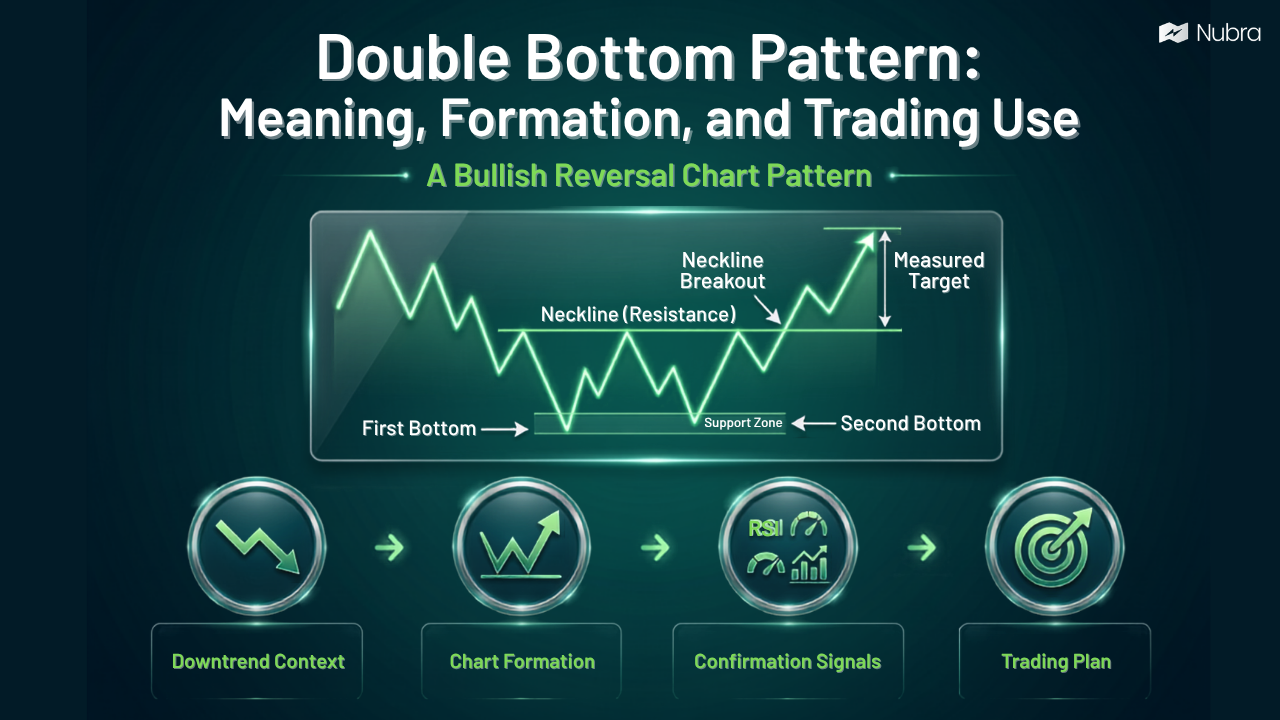
Double Bottom Pattern: Meaning, Formation, and Trading Use
A double bottom pattern is a bullish reversal chart pattern that forms after a downtrend. It shows that price has tested a support zone twice, failed to break meaningfully lower, and then started moving back toward resistance. On a chart, it often looks like the letter W. For traders, the double bottom turns a messy…
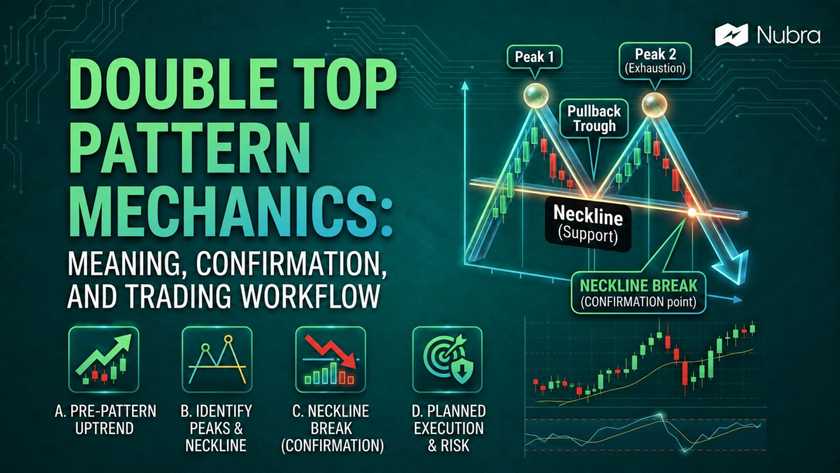
Double Top Pattern: Meaning, Confirmation, and Trading Workflow
A double top pattern is a bearish reversal chart pattern that forms after an uptrend. It appears when price rises to a resistance area, pulls back, rises again toward a similar high, and then fails to continue higher. The pattern starts to matter only when price breaks below the support area between the two peaks,…
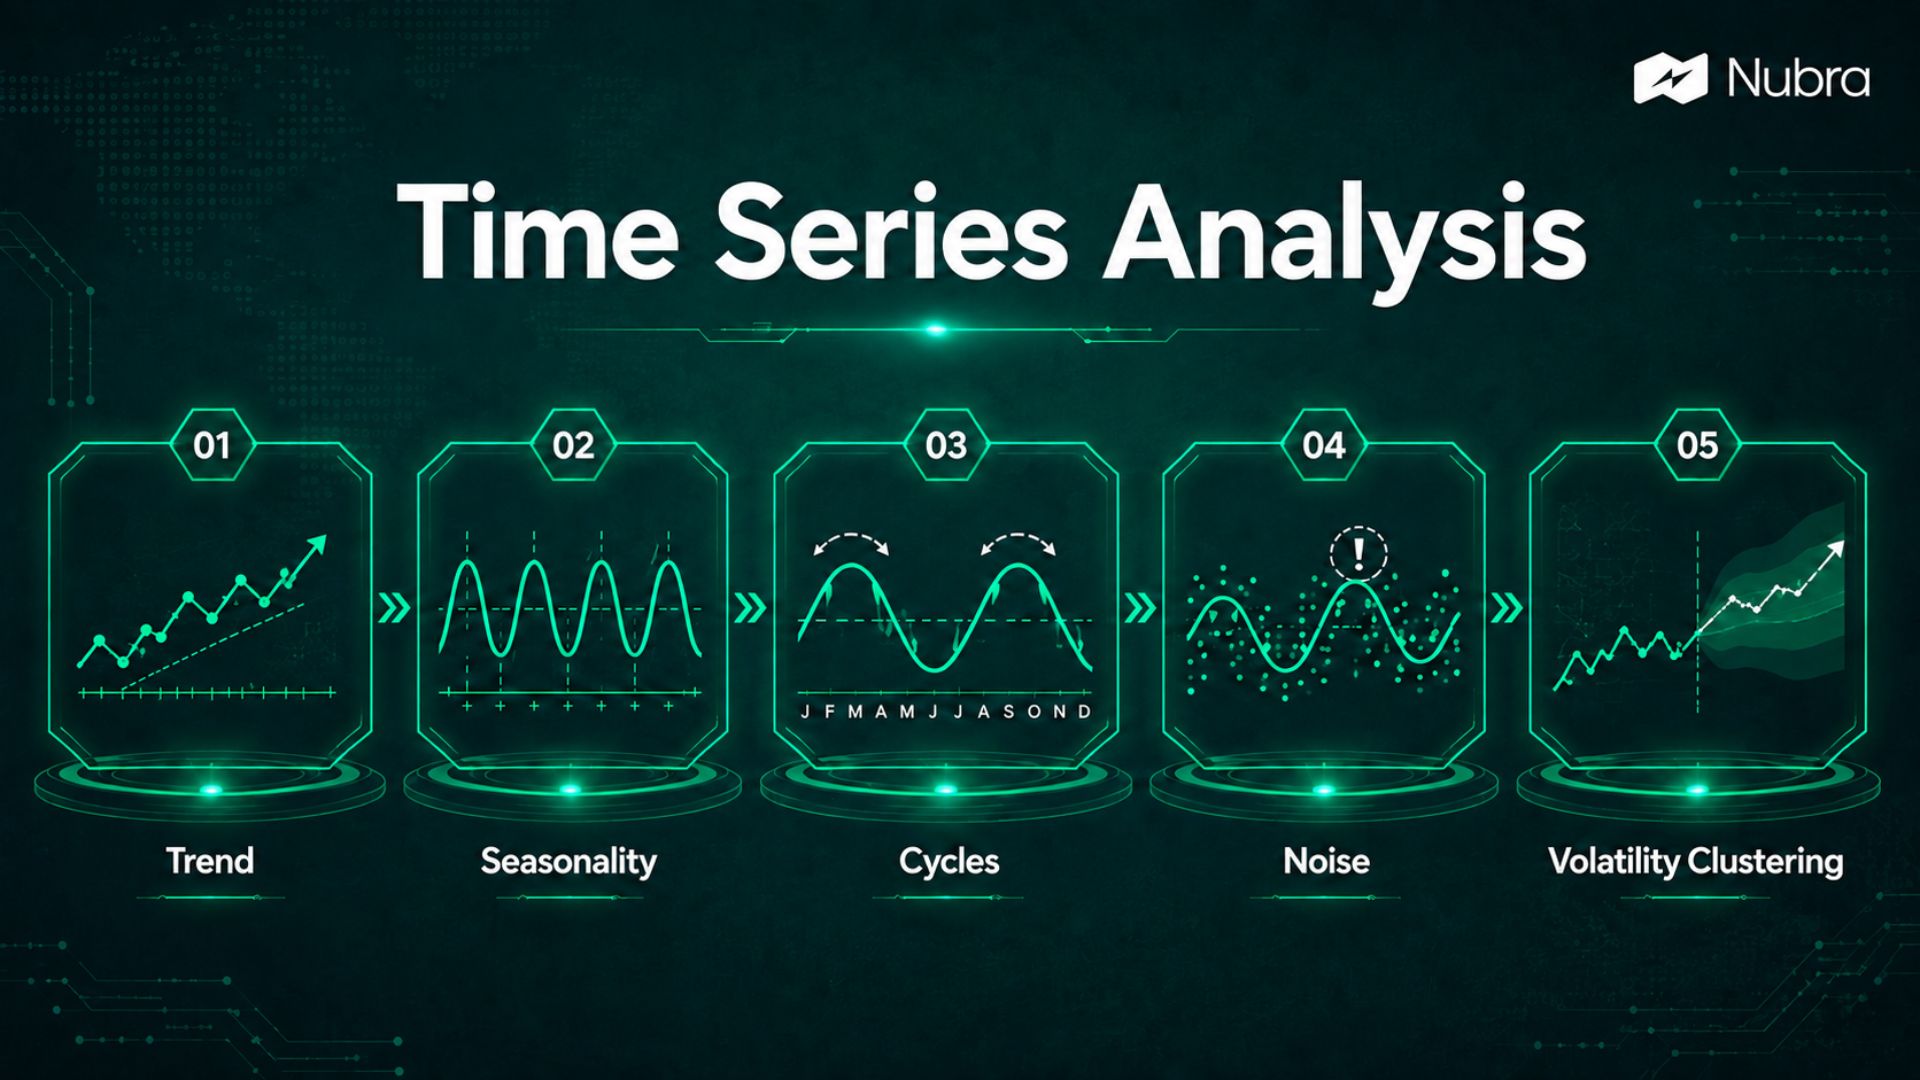
Time Series Analysis: Meaning, Methods, and Trading Uses
Time series analysis is the study of data points arranged in time order. In trading, this usually means looking at market data such as price, returns, volume, volatility, open interest, implied volatility, or indicator values across minutes, days, weeks, or months. The goal is simple: we study how a variable has behaved over time so…
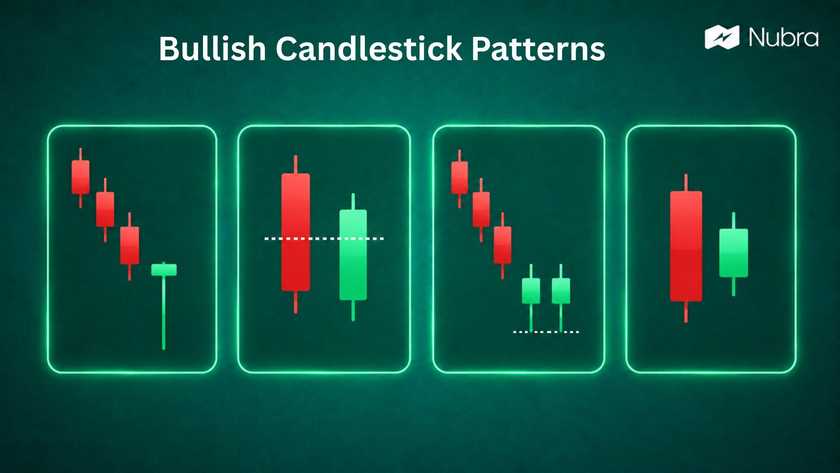
Bullish Candlestick Patterns: 9 Setups Traders Watch
Bullish candlestick patterns help traders read where buying interest may be returning to a chart. They are useful because they turn price action into a visual story: sellers tried to push the market lower, buyers responded, and the candle closed in a way that suggests the balance may be shifting. That shift is important, but…
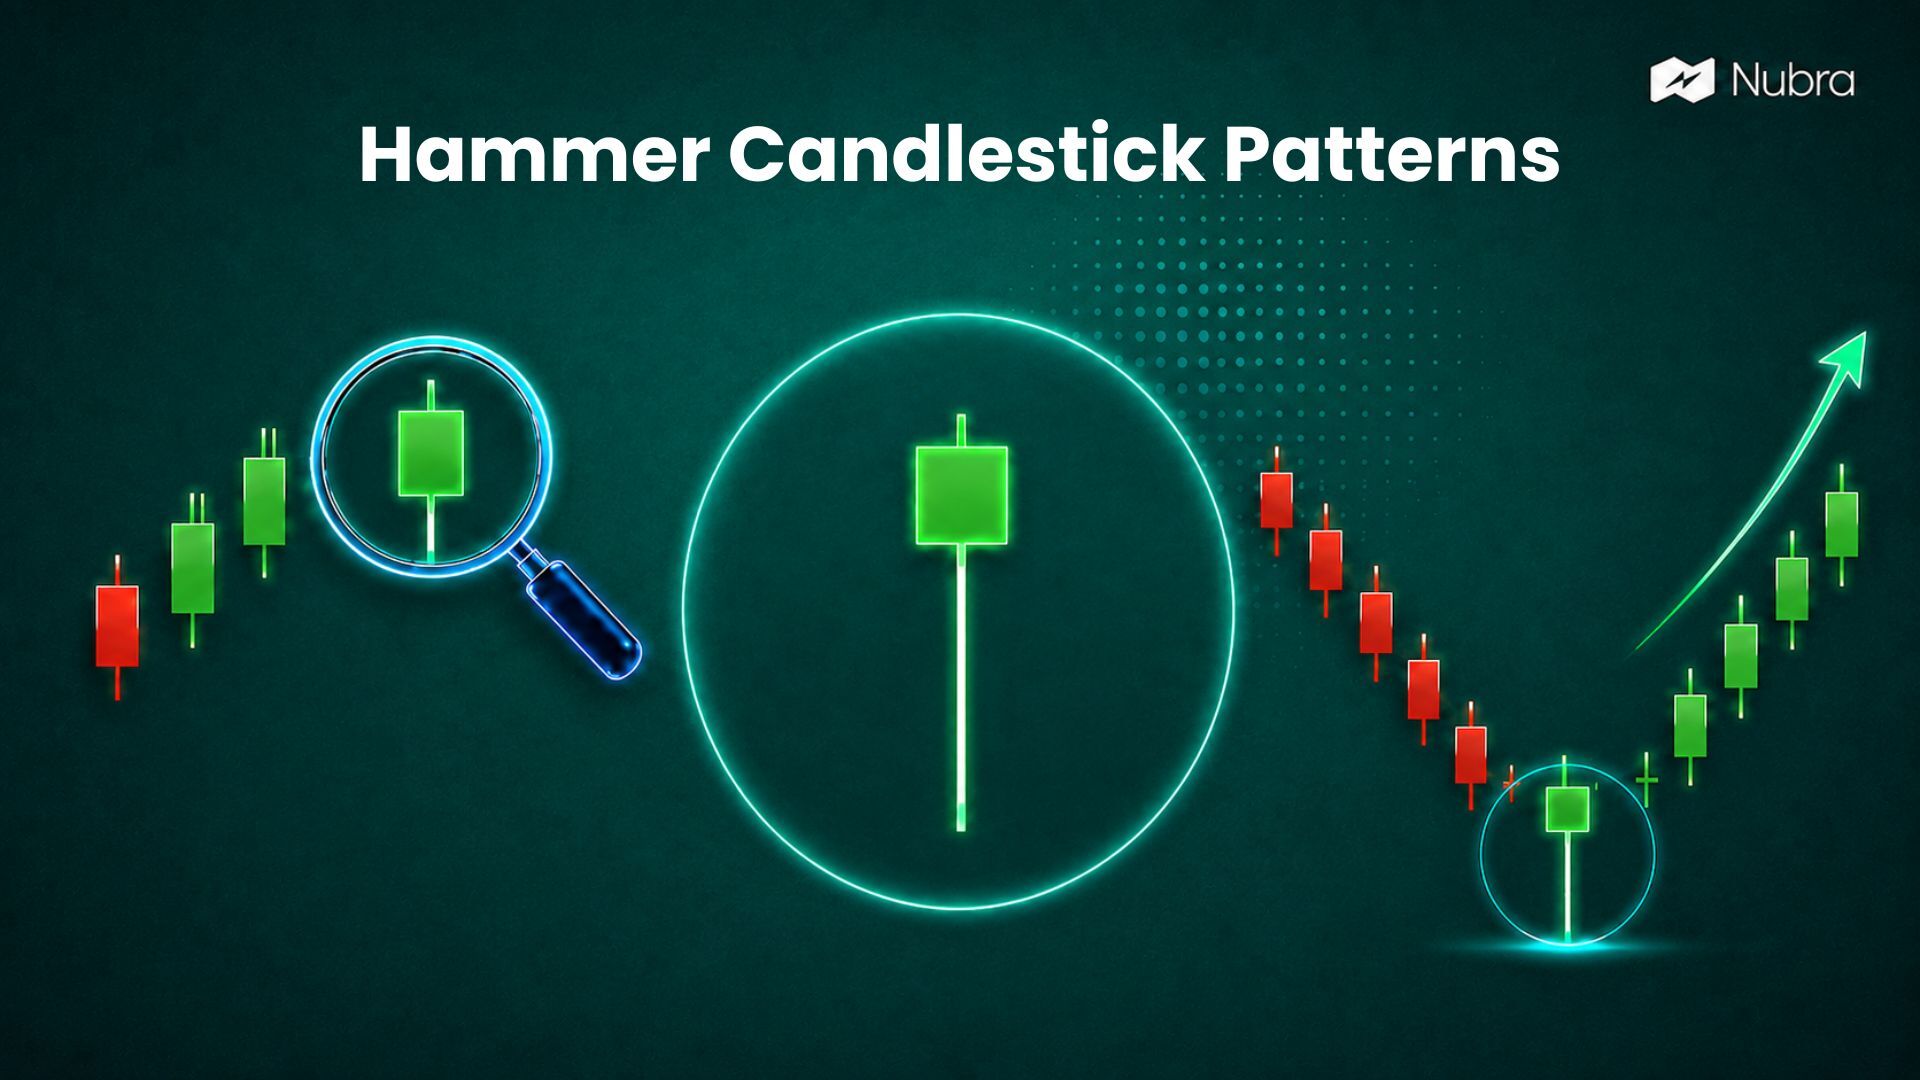
Hammer Candlestick Patterns: Meaning, Types, and Trading Use
A hammer candlestick pattern is a single-candle technical analysis pattern that appears after a price decline and signals a possible bullish reversal. It does not confirm a reversal by itself, but it shows that sellers pushed the price lower during the session and buyers were able to pull it back near the opening or closing…
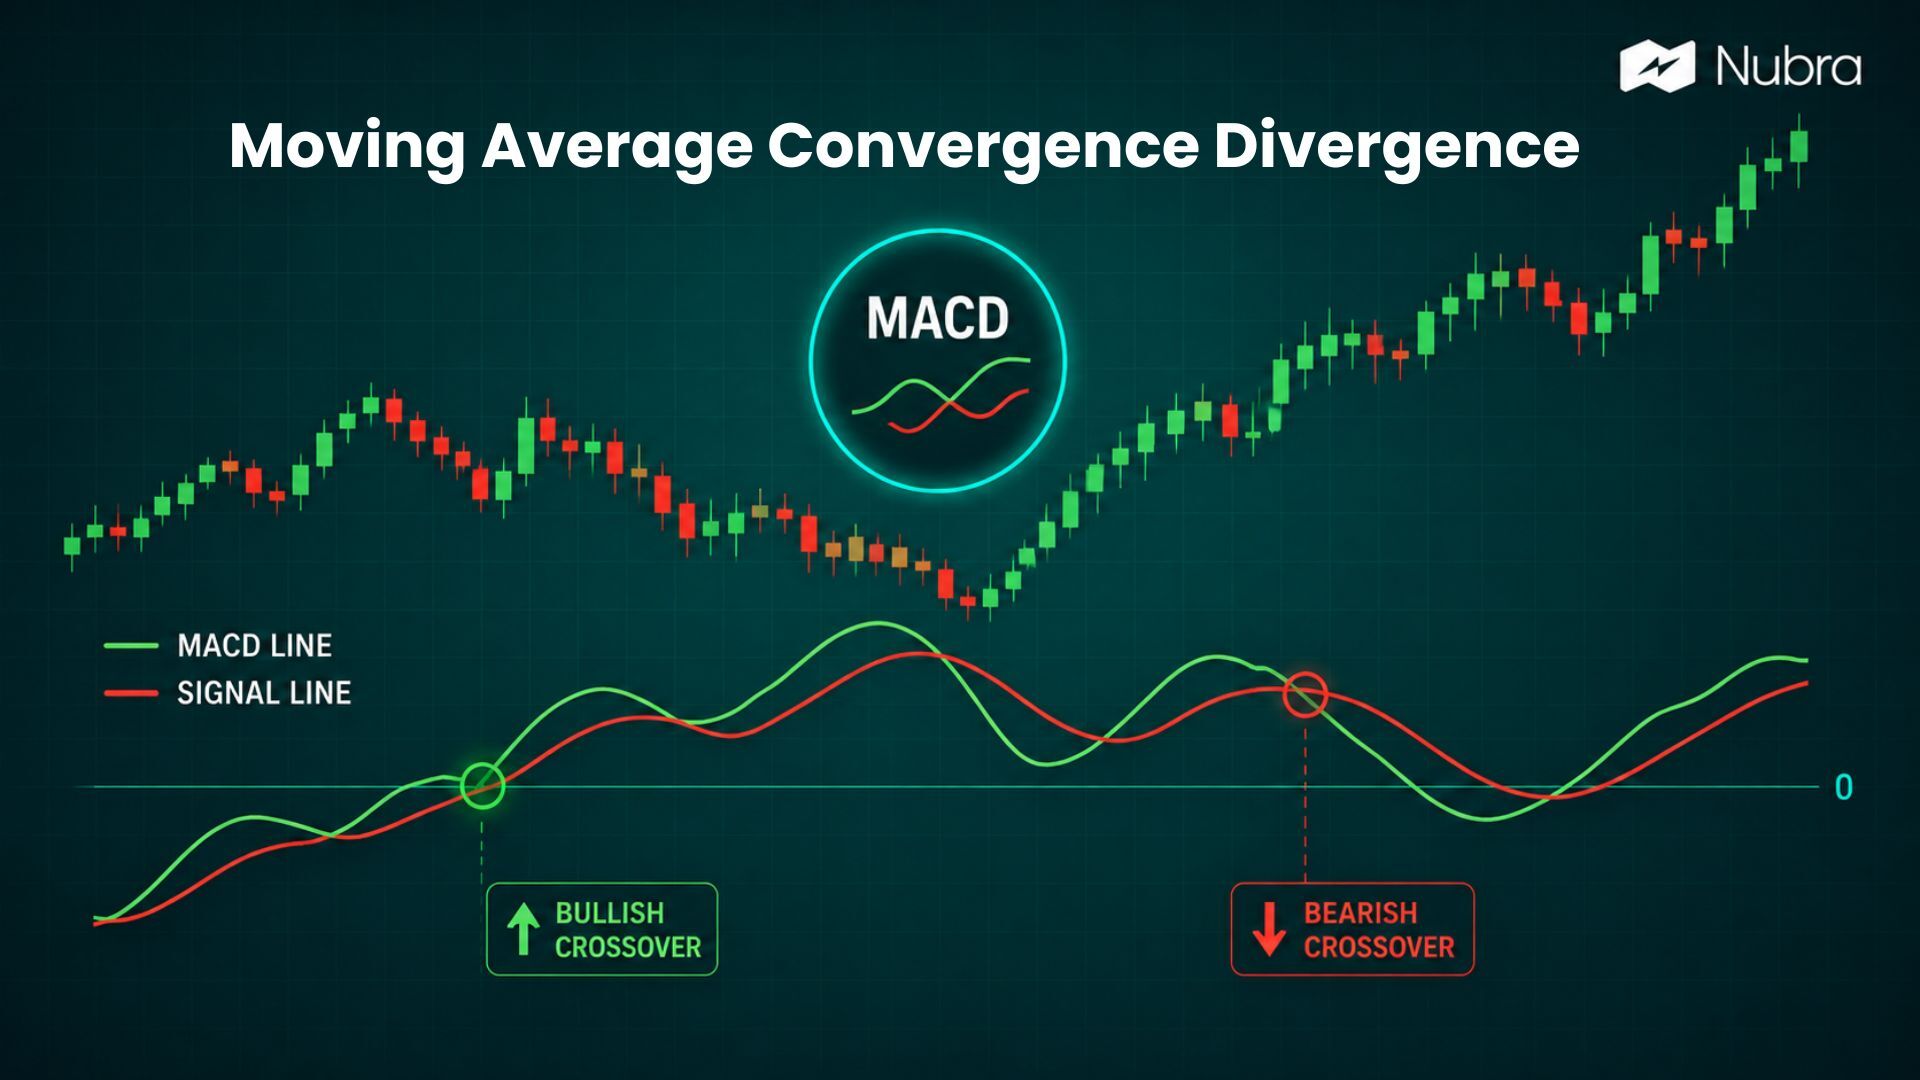
Moving Average Convergence Divergence (MACD): Meaning, Formula, and How Traders Read It
Moving Average Convergence Divergence, commonly called MACD, is a technical indicator that helps traders study trend direction and momentum. It compares two exponential moving averages of price, then turns that relationship into a line, a signal line, and a histogram. In simple terms, MACD helps us answer three practical questions on a chart: is momentum…
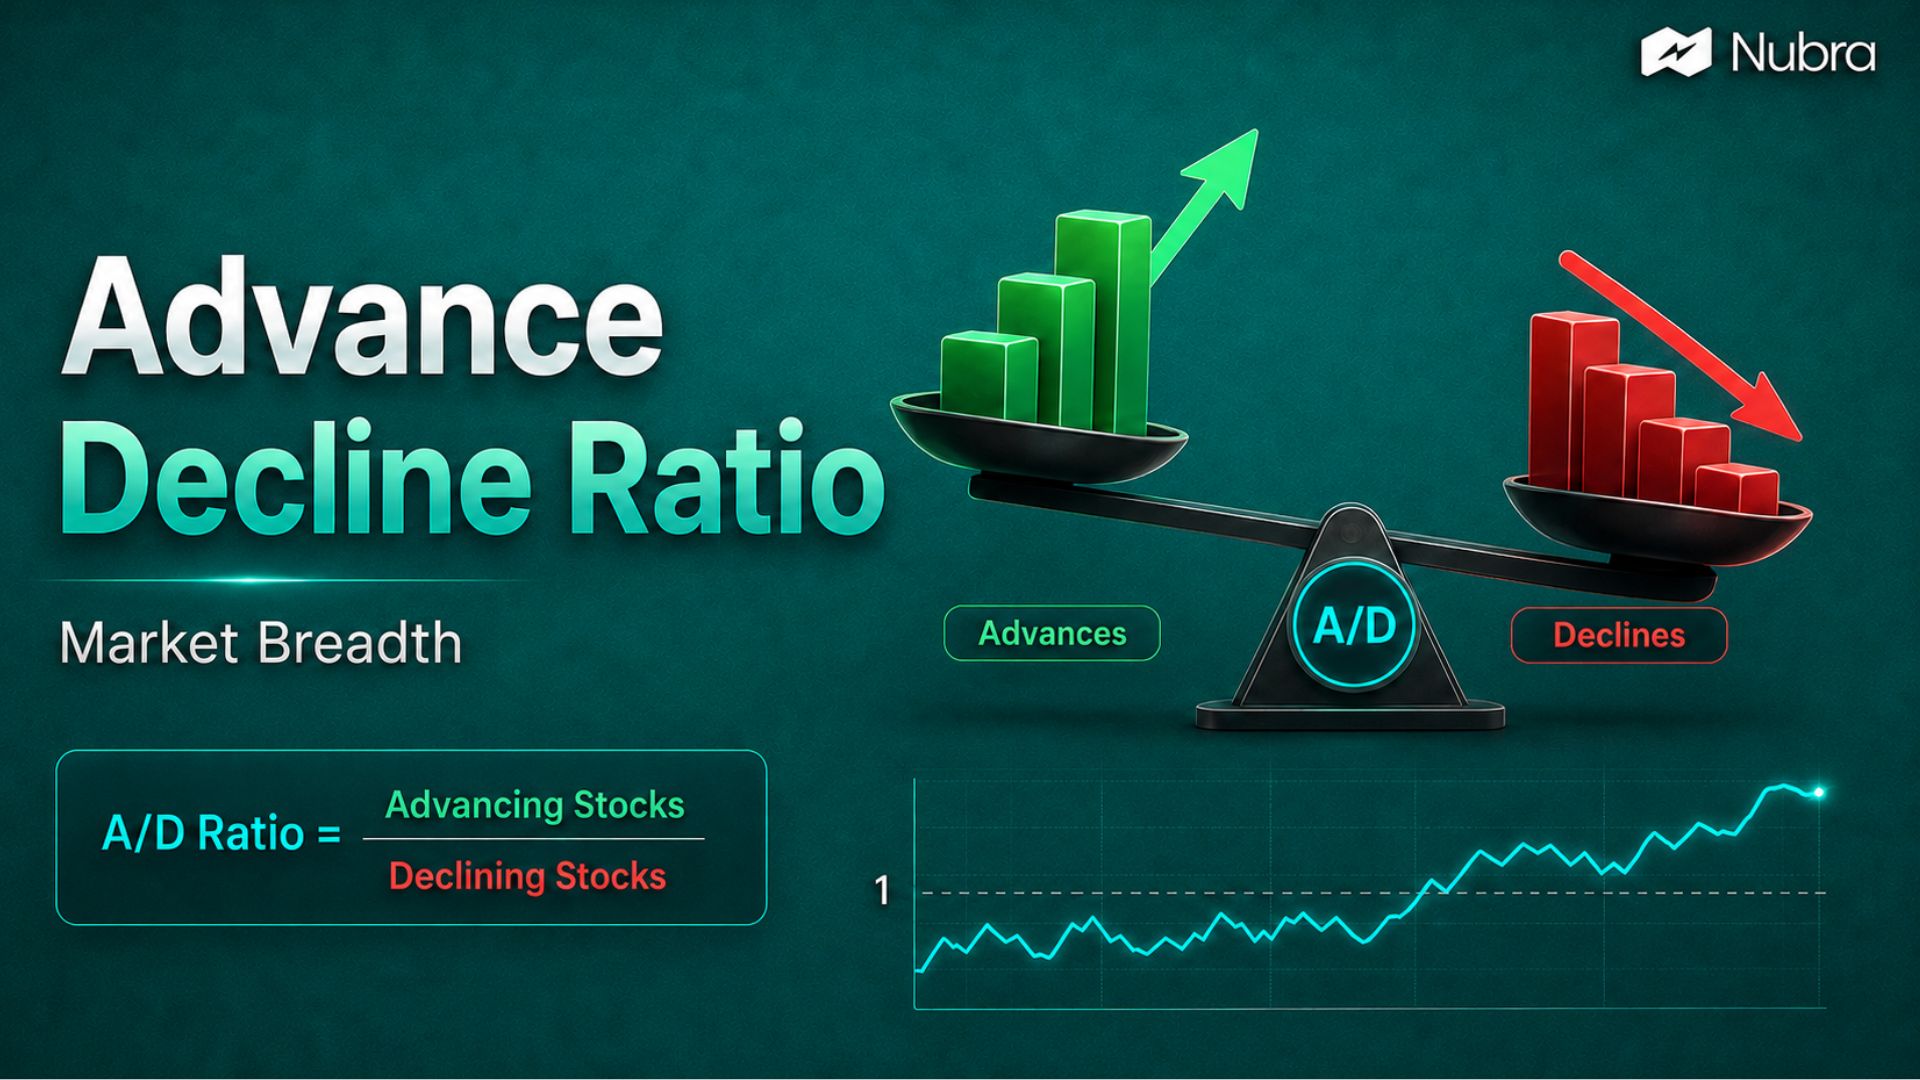
Advance Decline Ratio: Meaning, Formula, and How Traders Read Market Breadth
The advance decline ratio is a market breadth indicator that compares how many stocks are rising with how many stocks are falling during a trading session. It helps us look beyond the headline index and understand whether the broader market is participating in that move. If Nifty or Sensex is up but only a small…
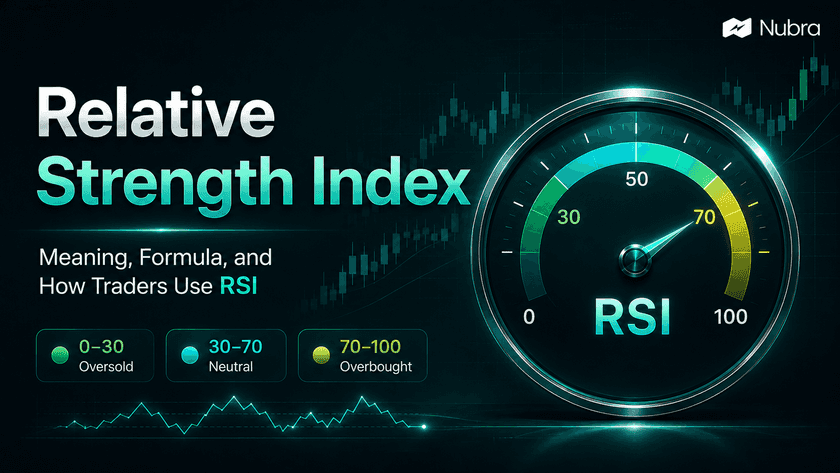
Relative Strength Index: Meaning, Formula, and How Traders Use RSI
What is the Relative Strength Index? The Relative Strength Index, or RSI, is a momentum indicator used in technical analysis. It measures the speed and size of recent price movements and converts that momentum into a value between 0 and 100. For traders, RSI is useful because it gives a quick read on whether price…
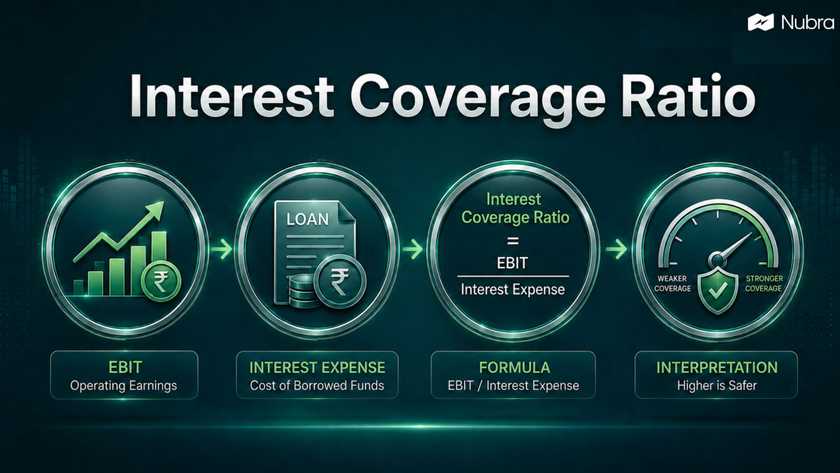
Interest Coverage Ratio
What Is Interest Coverage Ratio? Interest coverage ratio is a solvency ratio that shows how comfortably a company can pay interest on its debt from operating earnings. It shows whether the business earns enough before interest and tax to handle finance costs. Debt stress often appears before a company misses a repayment. If interest expense…

Debt to Equity Ratio: Meaning, Formula, Calculation and Interpretation
The debt-to-equity ratio shows how much debt a company has compared with the money owned by shareholders. It is one of the simplest ways to check whether a company is funding itself mainly through borrowings or through its own equity base. In simple words, the debt-to-equity ratio, or D/E ratio, compares borrowed money with owners’…
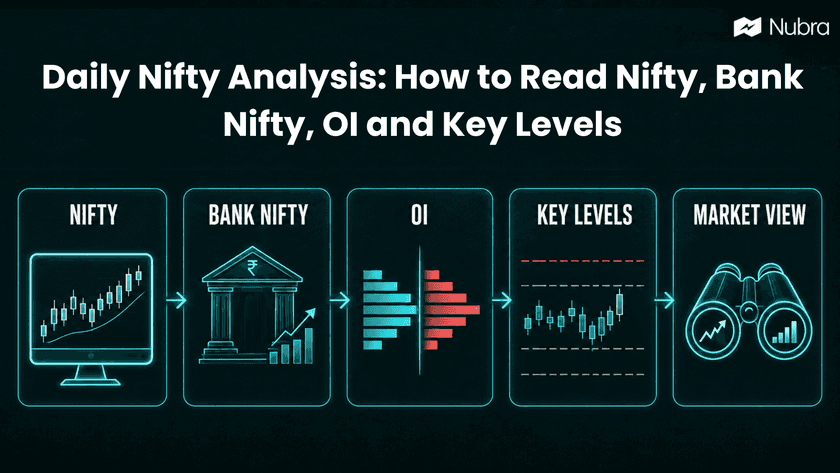
Daily Nifty Analysis
Daily Nifty analysis is not just about asking whether the market will go up or down tomorrow. A useful analysis helps a trader understand four things: where the trend is, where the index can pause, what the option chain is suggesting, and what would prove the view wrong. That last question matters the most. If…
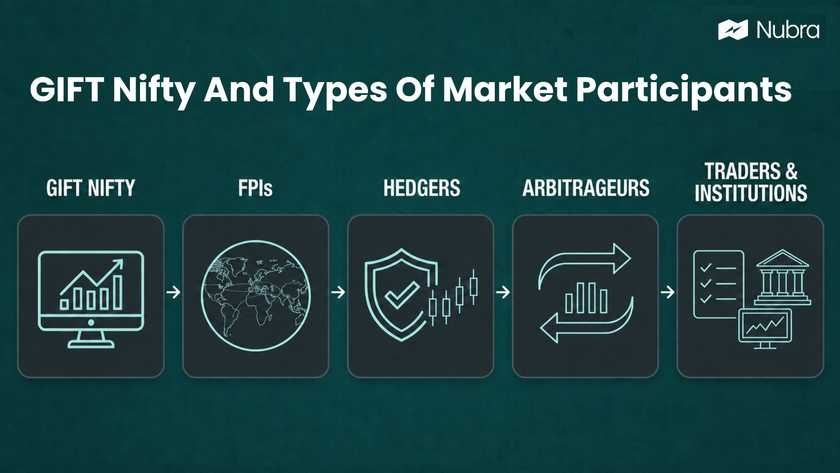
GIFT Nifty And Types Of Market Participants
GIFT Nifty is the US dollar-denominated Nifty derivatives contract traded on NSE International Exchange, or NSE IX, in GIFT City. I look at it as more than a pre-market number. It is a bridge between Indian equity-market expectations and global trading hours. For years, many Indian traders watched SGX Nifty before the domestic market opened…