Nubra Blogs
The Ultimate Guide to Options Trading
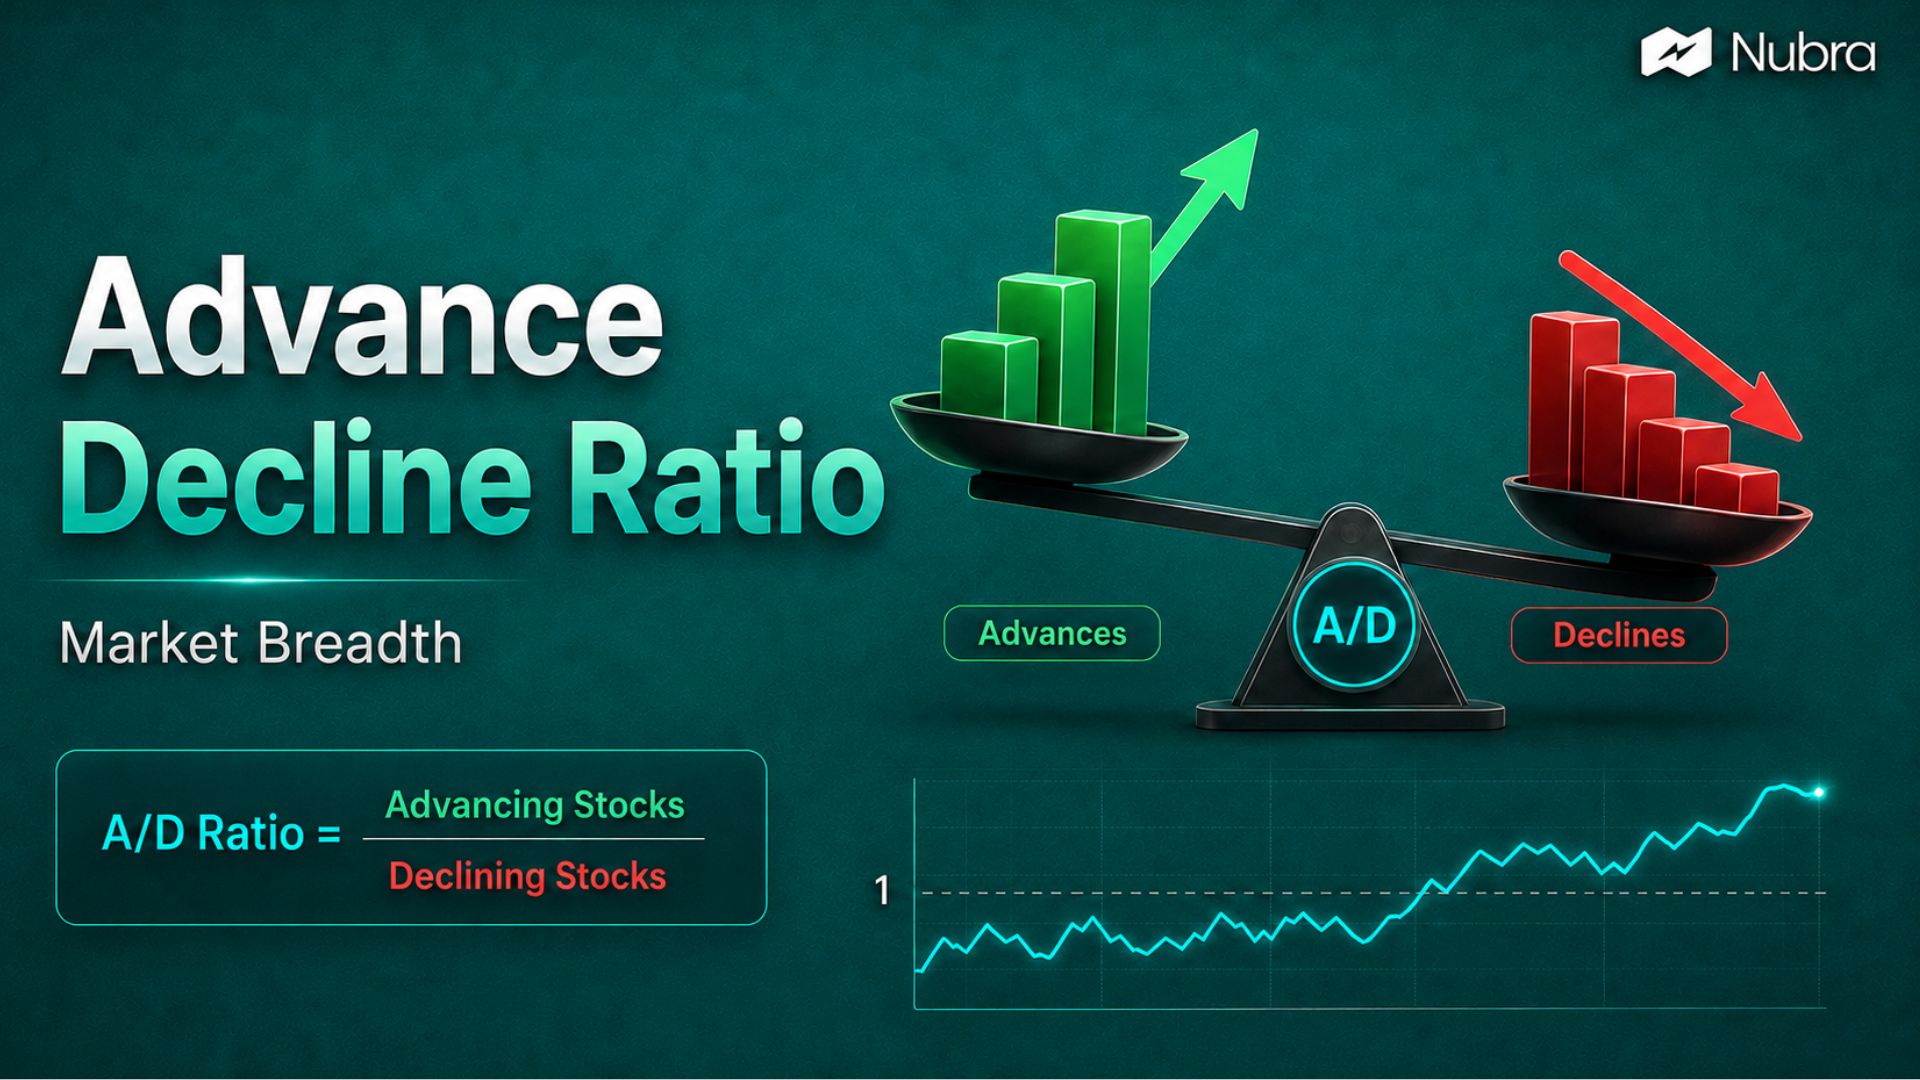
Advance Decline Ratio: Meaning, Formula, and How Traders Read Market Breadth
The advance decline ratio is a market breadth indicator that compares how many stocks are rising with how many stocks are falling during a trading session. It helps us look beyond the headline index and understand whether the broader market is participating in that move. If Nifty or Sensex is up but only a small…
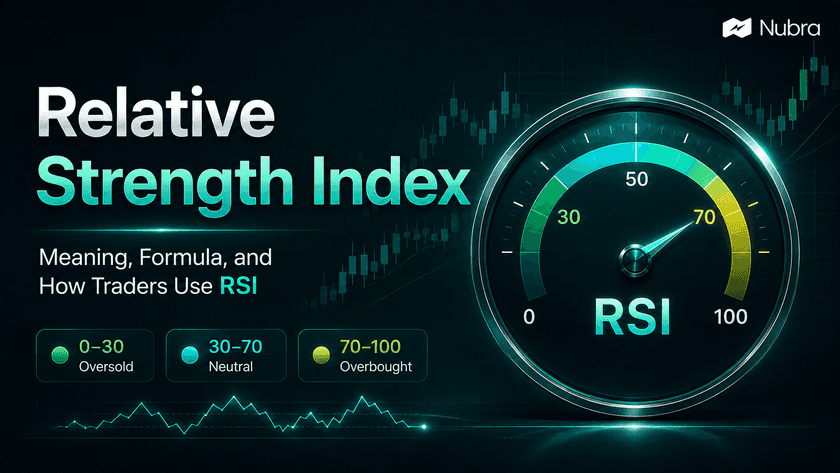
Relative Strength Index: Meaning, Formula, and How Traders Use RSI
What is the Relative Strength Index? The Relative Strength Index, or RSI, is a momentum indicator used in technical analysis. It measures the speed and size of recent price movements and converts that momentum into a value between 0 and 100. For traders, RSI is useful because it gives a quick read on whether price…
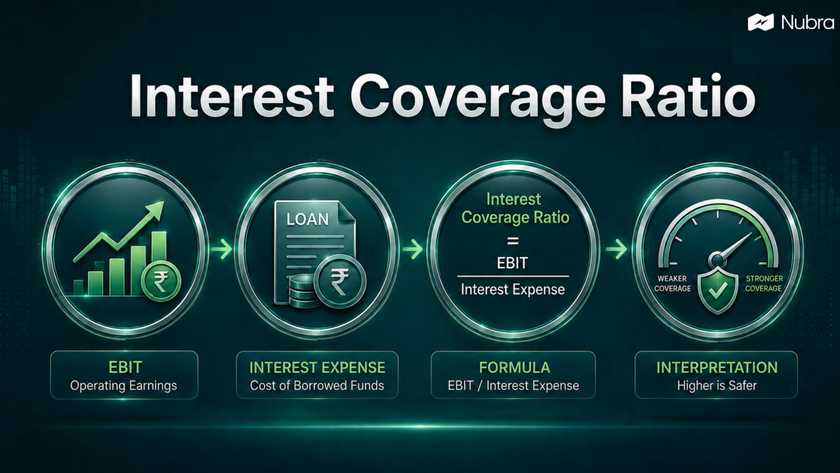
Interest Coverage Ratio
What Is Interest Coverage Ratio? Interest coverage ratio is a solvency ratio that shows how comfortably a company can pay interest on its debt from operating earnings. It shows whether the business earns enough before interest and tax to handle finance costs. Debt stress often appears before a company misses a repayment. If interest expense…

Debt to Equity Ratio: Meaning, Formula, Calculation and Interpretation
The debt-to-equity ratio shows how much debt a company has compared with the money owned by shareholders. It is one of the simplest ways to check whether a company is funding itself mainly through borrowings or through its own equity base. In simple words, the debt-to-equity ratio, or D/E ratio, compares borrowed money with owners’…
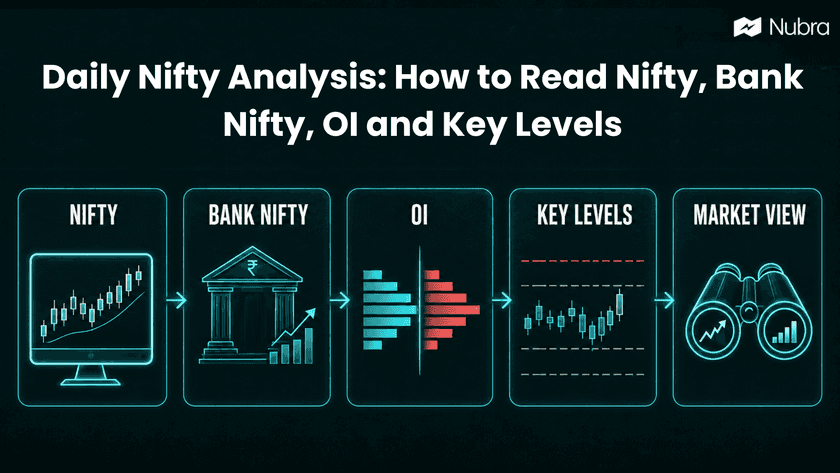
Daily Nifty Analysis
Daily Nifty analysis is not just about asking whether the market will go up or down tomorrow. A useful analysis helps a trader understand four things: where the trend is, where the index can pause, what the option chain is suggesting, and what would prove the view wrong. That last question matters the most. If…
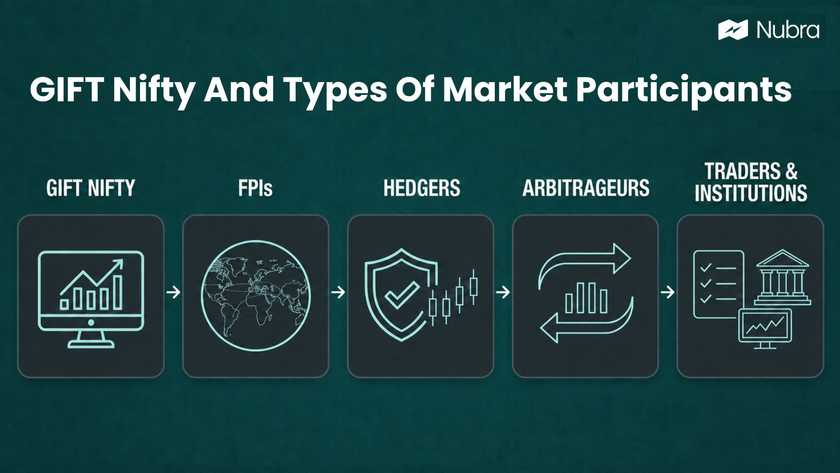
GIFT Nifty And Types Of Market Participants
GIFT Nifty is the US dollar-denominated Nifty derivatives contract traded on NSE International Exchange, or NSE IX, in GIFT City. I look at it as more than a pre-market number. It is a bridge between Indian equity-market expectations and global trading hours. For years, many Indian traders watched SGX Nifty before the domestic market opened…
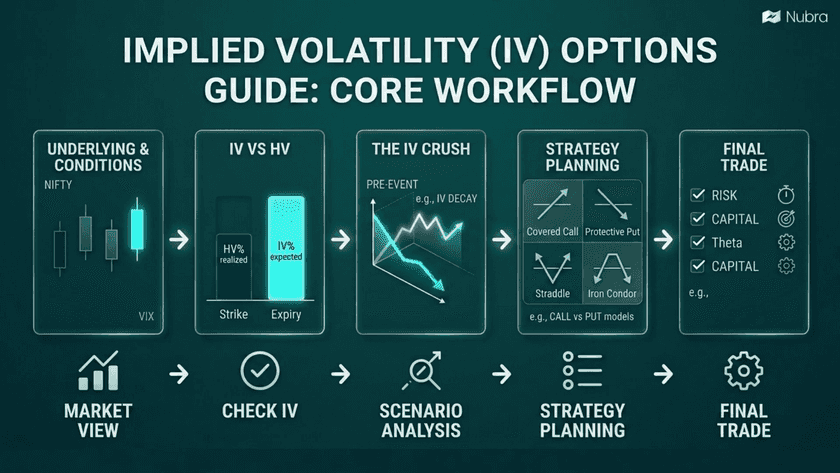
What Is Implied Volatility in Options?
Implied volatility, or IV, is the market’s estimate of how much an underlying asset may move during the remaining life of an option. I do not read IV as a prediction that the price will go up or down. I read it as the option market’s expectation of movement size. That distinction matters. If a…
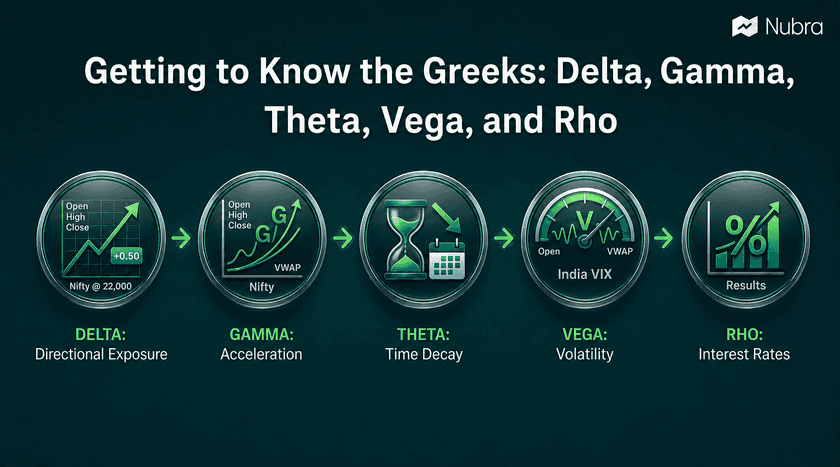
Getting to Know the Greeks: Delta, Gamma, Theta, Vega, and Rho in Options Trading
An option premium is not one clean number. It is a price being pulled by several forces at the same time: the underlying price, time left to expiry, implied volatility, strike selection, interest rates, and market expectations. The Greeks help separate those forces. Delta shows how much the option may respond when the underlying moves.…
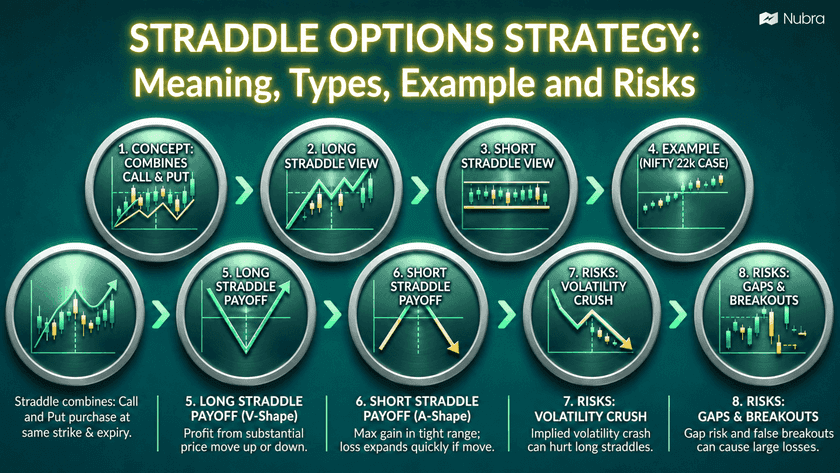
Straddle Options Strategy: Meaning, Types, Example and Risks
A straddle options strategy is a two-leg options strategy where I use a call option and a put option with the same underlying, same strike price, and same expiry. The idea is simple: instead of taking only a bullish or bearish view, I am taking a view on how much the market may move. In…
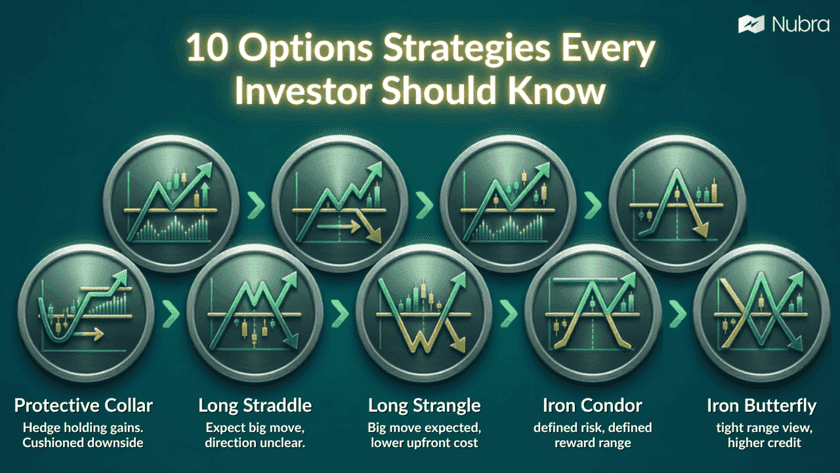
10 Options Strategies Every Investor Should Know
Options are flexible instruments, but that flexibility is exactly why I do not like treating them as shortcuts. A call option, a put option, and a few strike prices can be combined into many different payoff shapes. Some strategies are built for income. Some are built for hedging. Some are built for directional trades. Others…

40 Candlestick Patterns Traders Commonly Use
When you open a price chart, candlestick patterns help you see more than just whether the price moved up or down. They show how buyers and sellers behaved during that candle: who pushed first, who defended a level, who lost control, and whether the move had conviction. That is why candlesticks are useful, but only…
NSE and BSE Expiry Day Guide 2026
Expiry day in India is no longer one big Thursday habit. In 2026, the F&O calendar is split more cleanly: NSE runs on a Tuesday expiry cycle, while BSE runs on a Thursday expiry cycle. That sounds like a small calendar change until you are holding a weekly option on Monday afternoon and realize your…