Nubra Blogs

The Ultimate Guide to Options Trading

Double Bottom Pattern

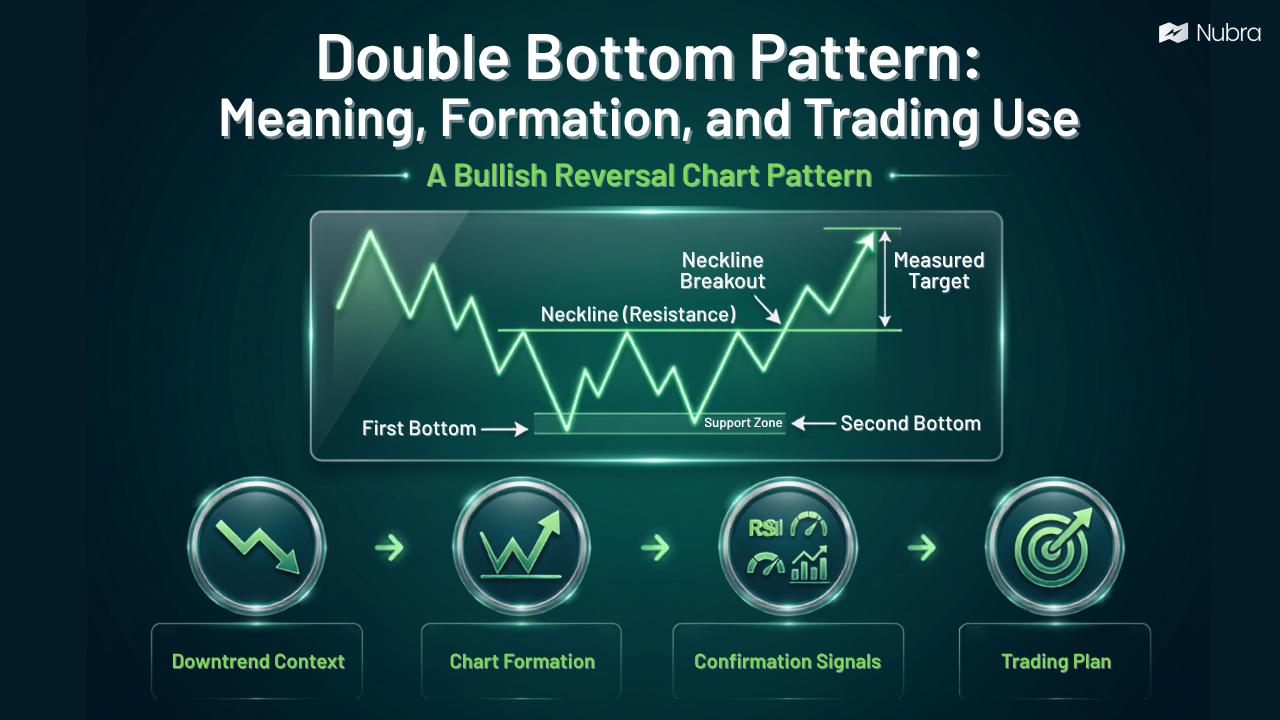
Double Bottom Pattern: Meaning, Formation, and Trading Use

A double bottom pattern is a bullish reversal chart pattern that forms after a downtrend. It shows that price has tested a support zone twice, failed to break meaningfully lower, and then started moving back toward resistance. On a chart, it often looks like the letter W. For traders, the double bottom turns a messy…

Aug 31, 2026
Read more
Double Top Pattern

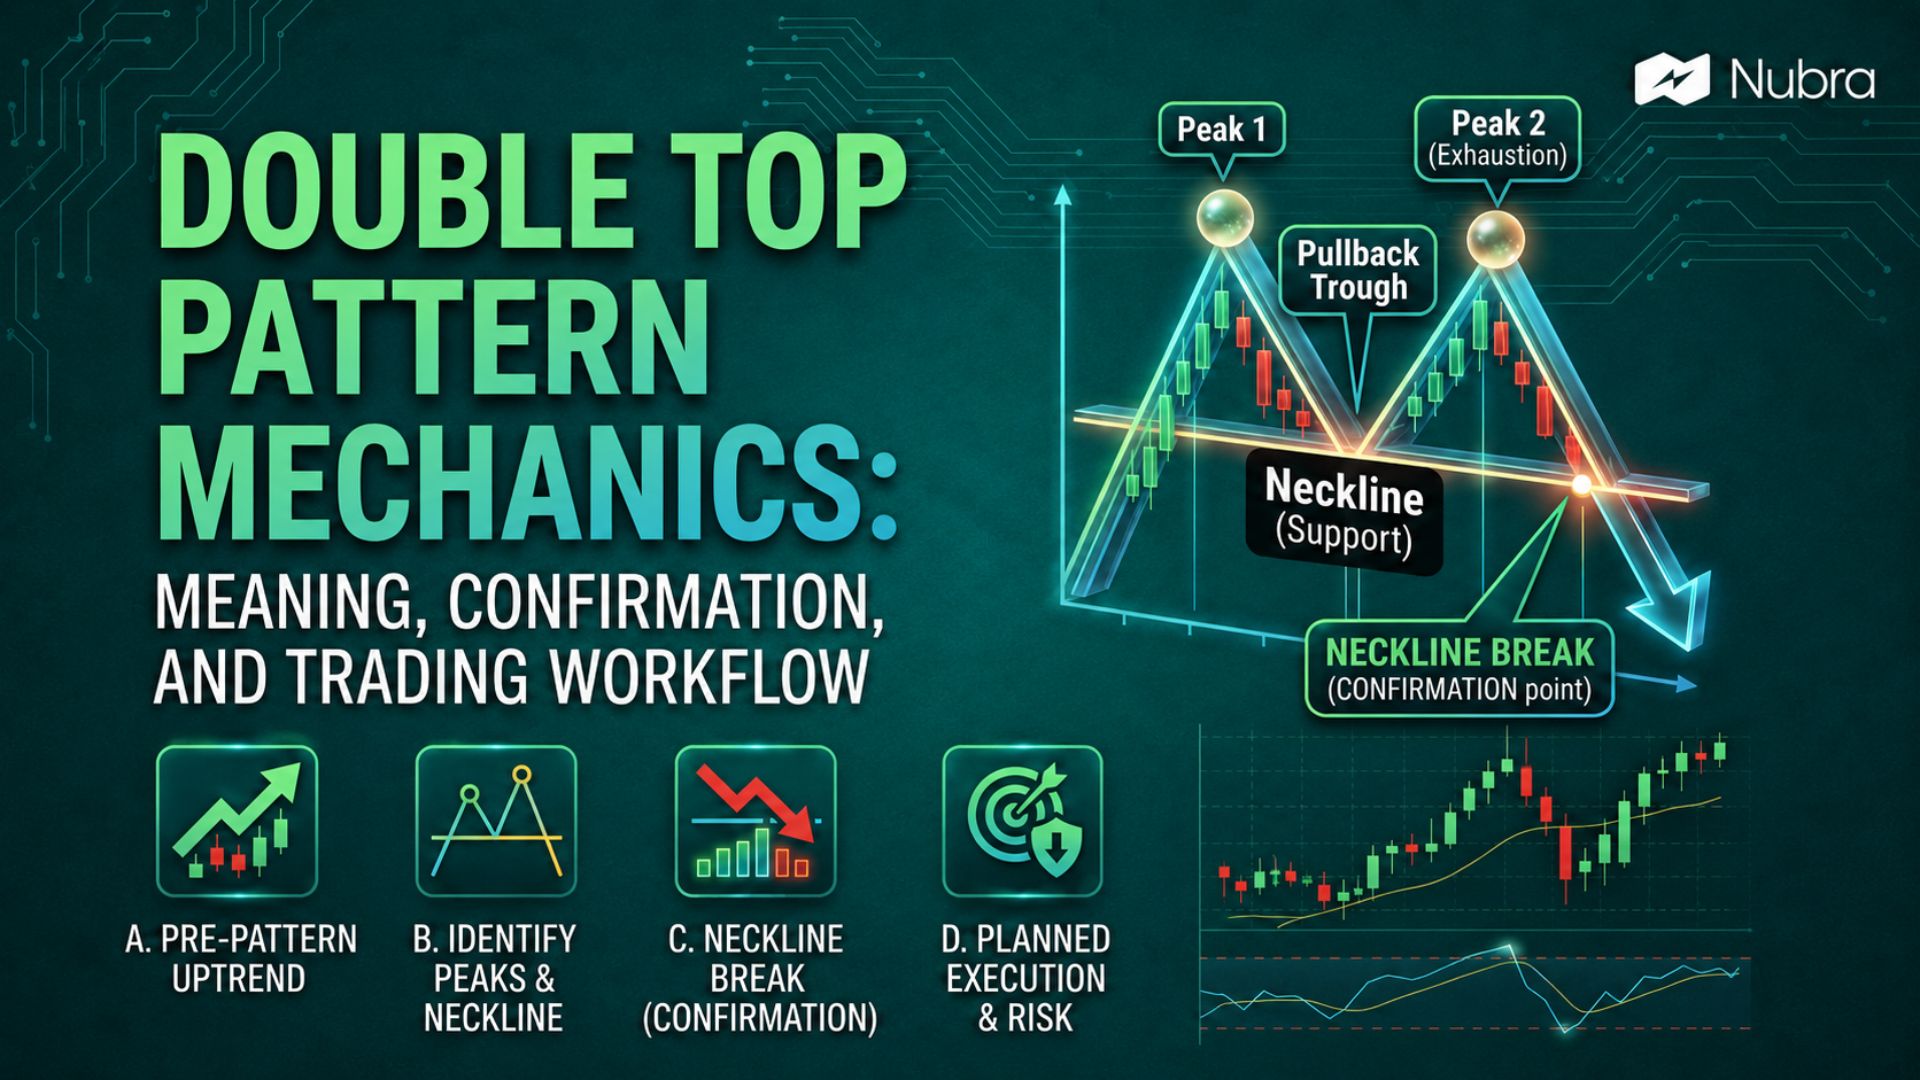
Double Top Pattern: Meaning, Confirmation, and Trading Workflow

A double top pattern is a bearish reversal chart pattern that forms after an uptrend. It appears when price rises to a resistance area, pulls back, rises again toward a similar high, and then fails to continue higher. The pattern starts to matter only when price breaks below the support area between the two peaks,…

Time Series Analysis

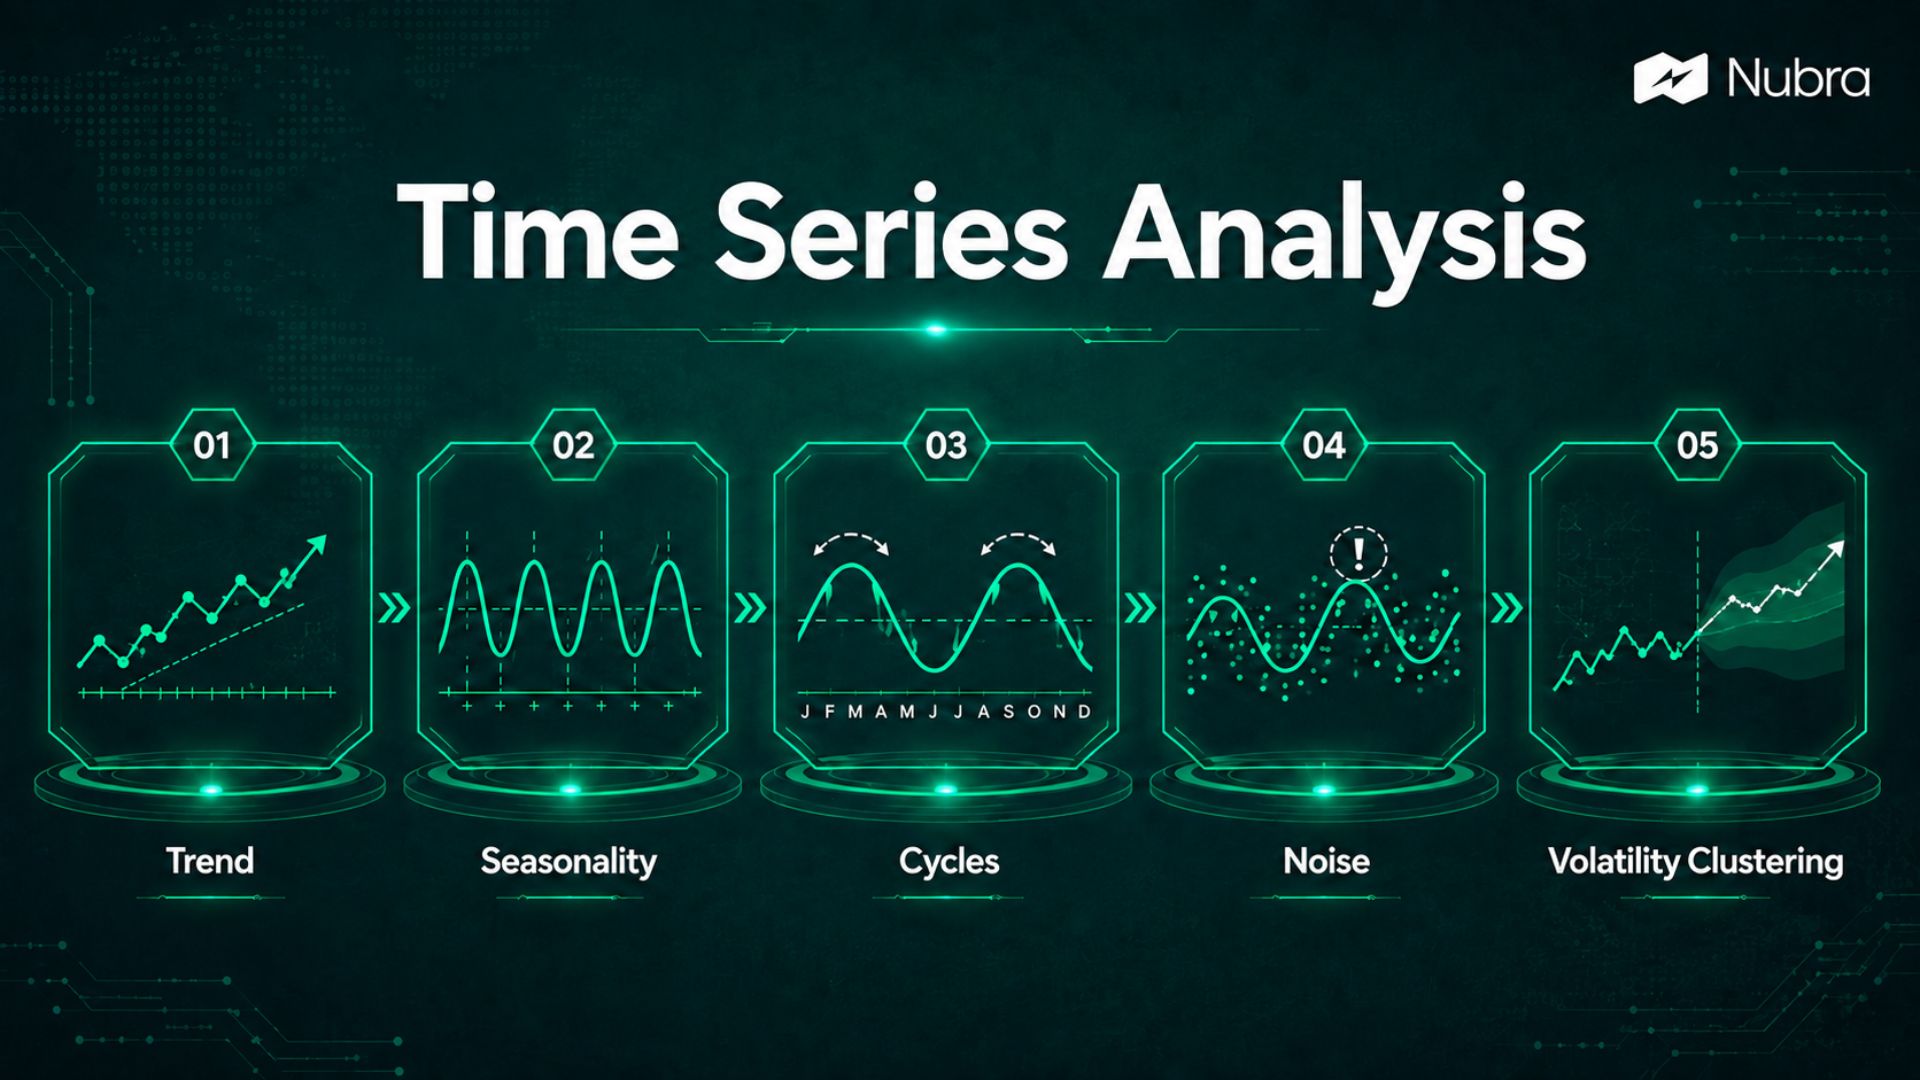
Time Series Analysis: Meaning, Methods, and Trading Uses

Time series analysis is the study of data points arranged in time order. In trading, this usually means looking at market data such as price, returns, volume, volatility, open interest, implied volatility, or indicator values across minutes, days, weeks, or months. The goal is simple: we study how a variable has behaved over time so…

Bullish Candlestick Patterns

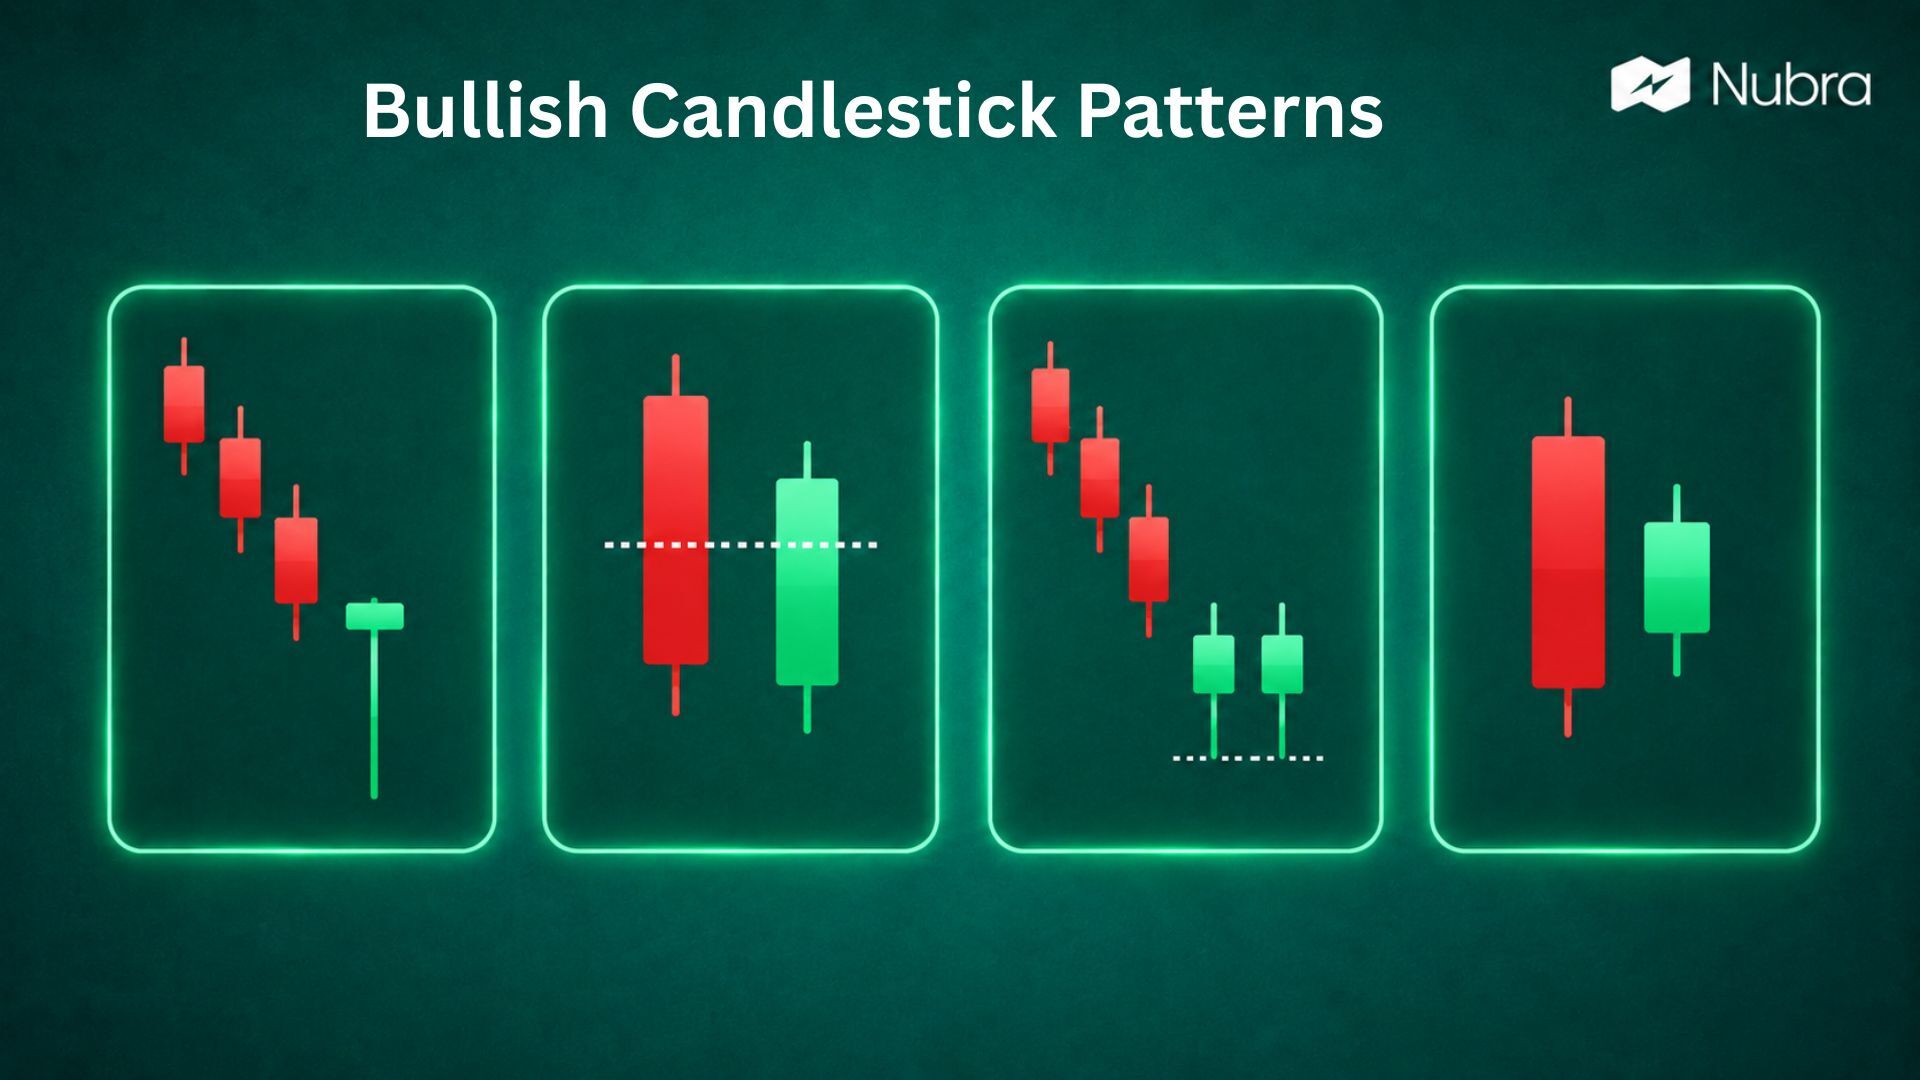
Bullish Candlestick Patterns: 9 Setups Traders Watch

Bullish candlestick patterns help traders read where buying interest may be returning to a chart. They are useful because they turn price action into a visual story: sellers tried to push the market lower, buyers responded, and the candle closed in a way that suggests the balance may be shifting. That shift is important, but…

Hammer Candlestick Patterns

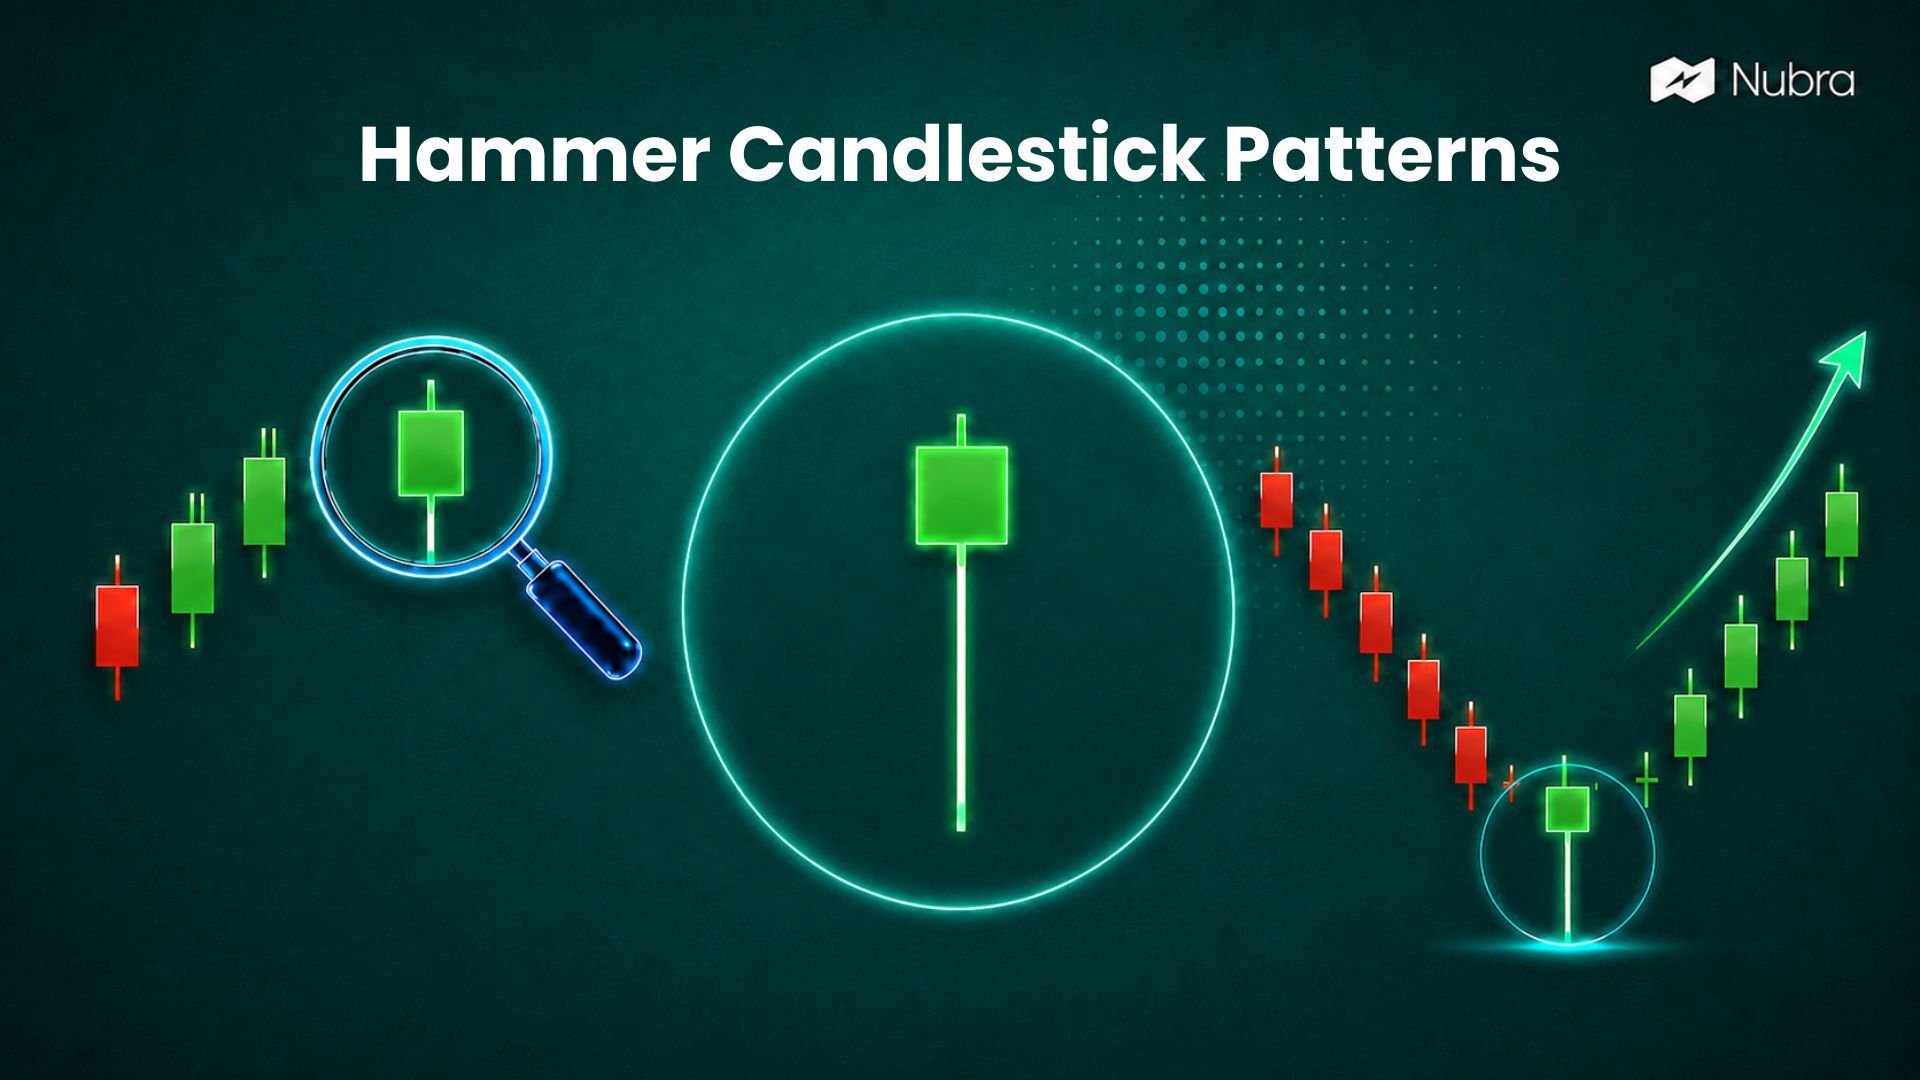
Hammer Candlestick Patterns: Meaning, Types, and Trading Use

A hammer candlestick pattern is a single-candle technical analysis pattern that appears after a price decline and signals a possible bullish reversal. It does not confirm a reversal by itself, but it shows that sellers pushed the price lower during the session and buyers were able to pull it back near the opening or closing…

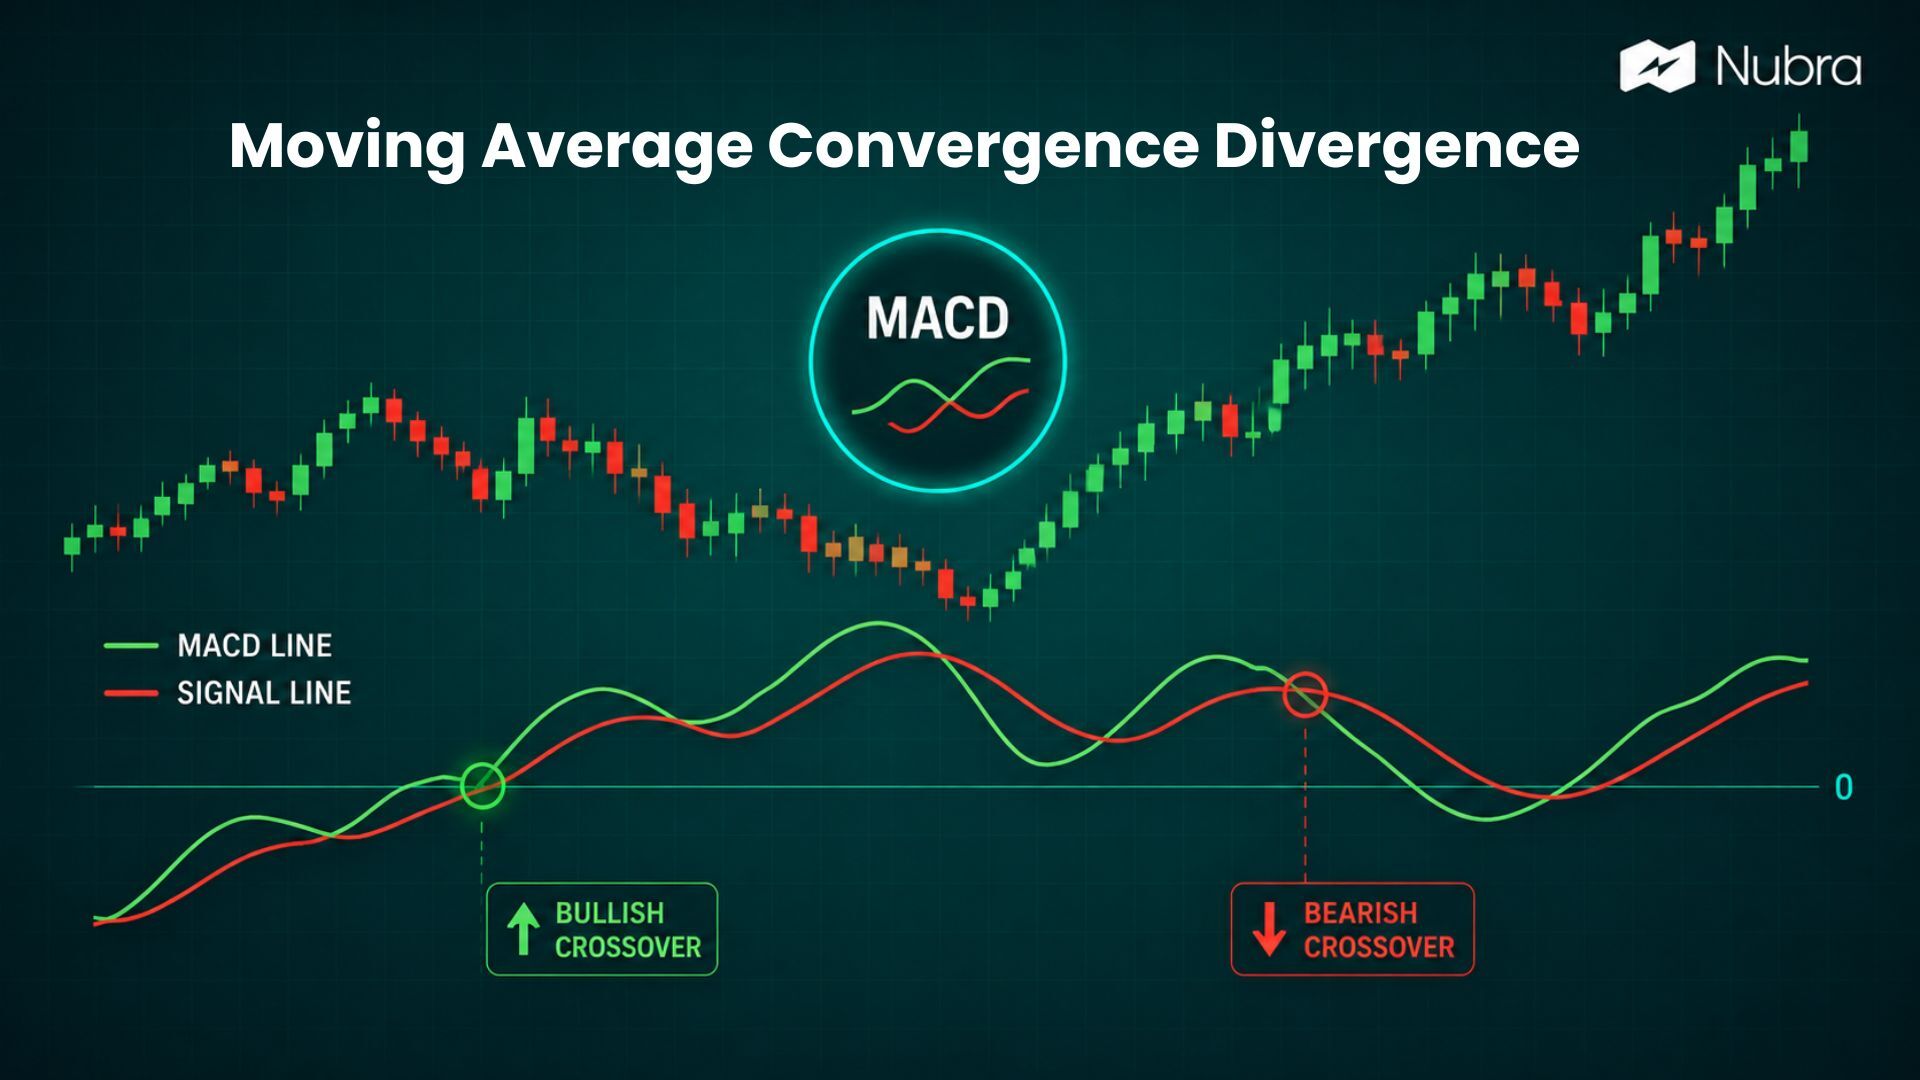
MACD

Moving Average Convergence Divergence (MACD): Meaning, Formula, and How Traders Read It

Moving Average Convergence Divergence, commonly called MACD, is a technical indicator that helps traders study trend direction and momentum. It compares two exponential moving averages of price, then turns that relationship into a line, a signal line, and a histogram. In simple terms, MACD helps us answer three practical questions on a chart: is momentum…

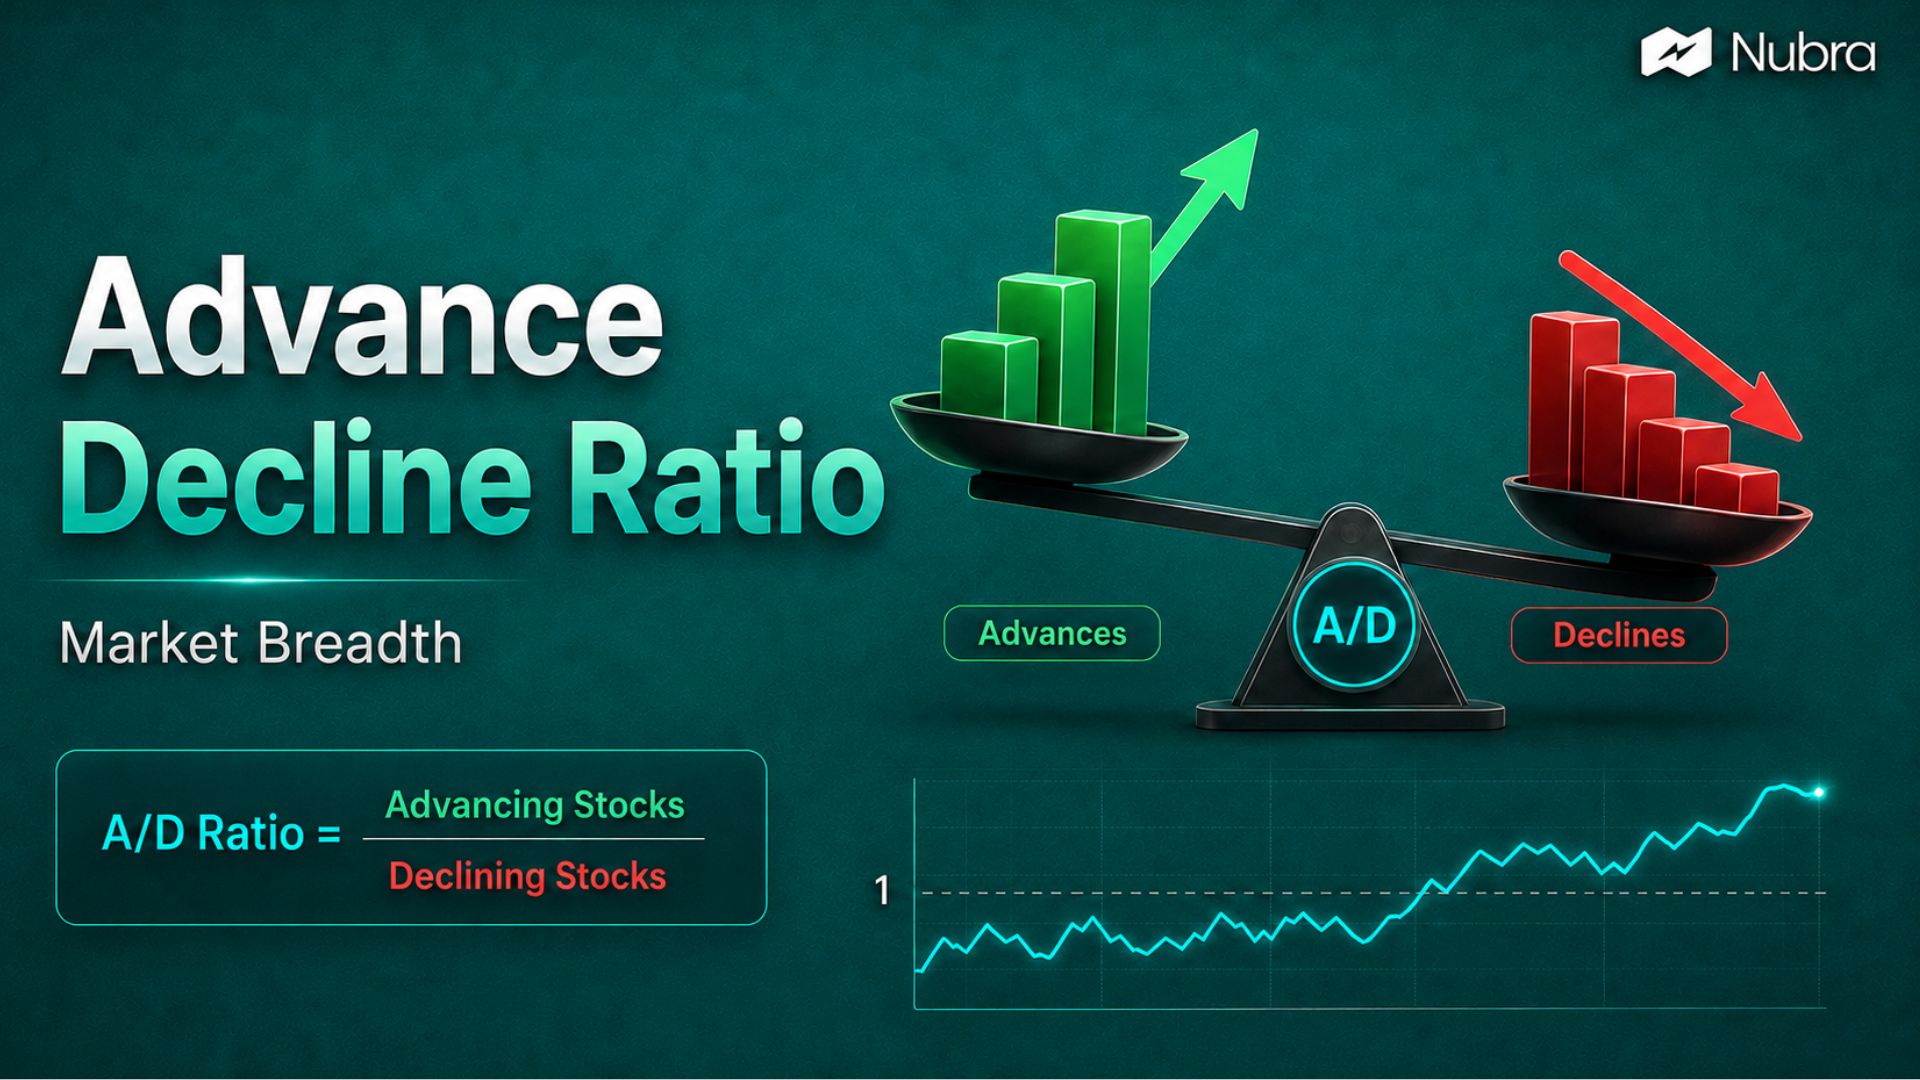
Advance Decline Ratio

Advance Decline Ratio: Meaning, Formula, and How Traders Read Market Breadth

The advance decline ratio is a market breadth indicator that compares how many stocks are rising with how many stocks are falling during a trading session. It helps us look beyond the headline index and understand whether the broader market is participating in that move. If Nifty or Sensex is up but only a small…

Swing trading in stock market

What is swing trading in stock market: Meaning, key strategies & tools

Imagine you bought a new pair of shoes on sale and noticed they went on sale again just a week later. As a swing trader, you might have waited to buy them at the lower price, capitalizing on the price fluctuation.
Swing trading is a popular trading strategy that aims to capture gains in a stock (or other financial instruments) over a period of a few days to several weeks. Unlike day trading, which involves quick trades within the same day, or long-term investing, which focuses on buy-and-hold strategies, swing trading falls somewhere in between.

This article delves into the intricacies of swing trading, exploring its definition, strategies, tools, and potential risks and rewards.

5 mins read