The advance decline ratio is a market breadth indicator that compares how many stocks are rising with how many stocks are falling during a trading session. It helps us look beyond the headline index and understand whether the broader market is participating in that move. If Nifty or Sensex is up but only a small…
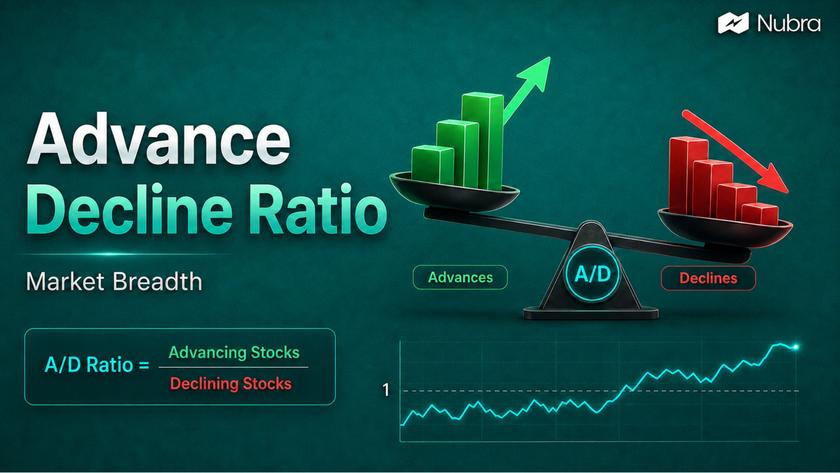
The advance decline ratio is a market breadth indicator that compares how many stocks are rising with how many stocks are falling during a trading session. It helps us look beyond the headline index and understand whether the broader market is participating in that move.
If Nifty or Sensex is up but only a small group of large stocks is carrying the index, the market may not be as broad as the chart suggests. If many stocks across sectors are advancing, the move has wider participation.
What Is the Advance Decline Ratio?
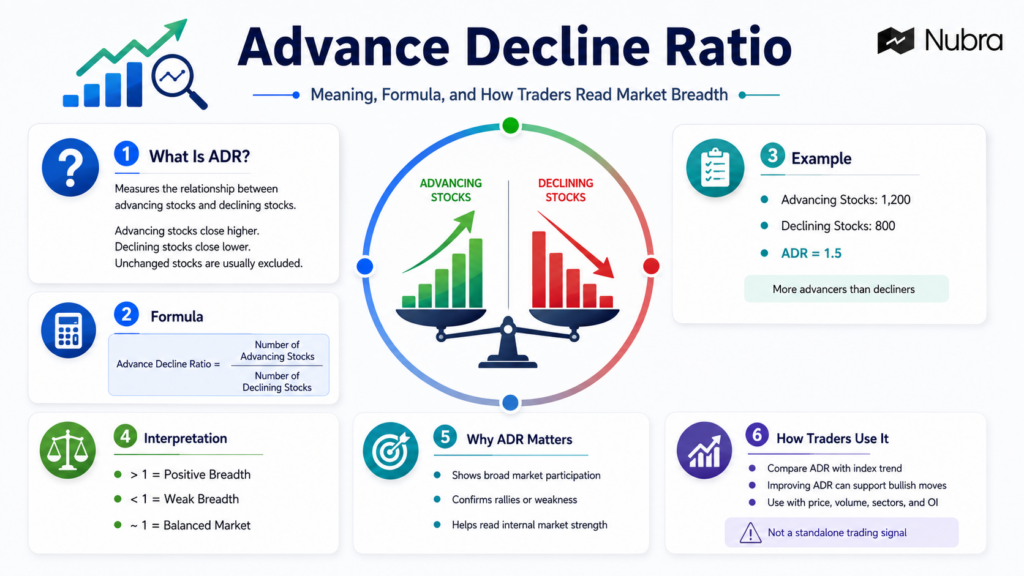
The advance decline ratio, often shortened to ADR or A/D ratio, measures the relationship between advancing stocks and declining stocks.
An advancing stock closes higher than its previous close. A declining stock closes lower than its previous close. Stocks that remain unchanged are usually excluded from the calculation.
In simple terms, ADR answers one question: are more stocks moving up or moving down?
Advance Decline Ratio Formula
The formula is:
Advance Decline Ratio = Number of Advancing Stocks / Number of Declining Stocks
For example, if 1,200 stocks advance and 800 stocks decline, the advance decline ratio is:
1,200 / 800 = 1.5
This means there were 1.5 advancing stocks for every declining stock. A ratio above 1 shows positive breadth. A ratio below 1 shows negative breadth.
How to Interpret the Advance Decline Ratio
An ADR above 1 usually points to positive market breadth because more stocks are rising than falling. An ADR below 1 usually points to weak breadth because more stocks are falling than rising.
A ratio near 1 suggests a balanced market. The index may still move because of a few heavyweight stocks, but broad participation may be limited.
The ratio becomes more useful when we compare it with the index trend. If the index is rising and ADR is also improving, the rally has broader support. If the index is rising while ADR is falling, fewer stocks may be participating.
The same logic applies on the downside. If the index is falling and ADR is weak, selling pressure is broad. If the index is falling but ADR starts improving, the decline may be losing breadth. It does not confirm a reversal, but it tells us that the internal market picture is changing.
Why ADR Matters for Traders
Index levels can hide what is happening inside the market. A market-cap-weighted index can rise because a few large stocks are strong, even when many smaller stocks are flat or weak. ADR gives a cleaner view of participation.
For active traders, this can be useful before reading intraday setups, sector moves, or F&O positioning. If broad breadth is strong, bullish breakouts may have better confirmation. If breadth is weak, even a green index may need more caution because the move may be concentrated in a few names.
In an Indian market context, traders may watch ADR alongside Nifty, Bank Nifty, sector indices, volume, open interest, option-chain data, and volatility. We should not treat any one of these as a complete signal. ADR works better as one layer in a larger market-reading process.
How to Use ADR in a Trading Workflow
ADR is most useful when tracked consistently. A single reading can tell us whether the current session is broad or narrow, but the trend across sessions often gives better context.
For example, if the index keeps making higher highs while ADR weakens, participation may be narrowing. If ADR improves while the index consolidates, more stocks may be building strength under the surface.
Traders can also compare ADR across timeframes. A daily reading helps with session-level breadth. A moving average can smooth noisy daily moves and show whether breadth is improving or deteriorating.
When using a trading platform like Nubra, the practical approach is to keep ADR connected to a broader decision workflow: index trend, sector participation, price action, volume, option-chain context, position sizing, and risk management. ADR can help frame the market environment, but it should not decide a trade by itself.
Limitations of the Advance Decline Ratio
The advance decline ratio is simple, and that simplicity is useful. But it also has limits.
ADR counts advancing and declining stocks equally. A small-cap stock and a large index heavyweight both count as one stock. That is useful for breadth, but it does not show each stock’s move size or index weight.
The ratio can also become noisy during volatile sessions. A very high ADR may show broad buying, but it can also reflect a sharp short-term reaction after a fall. A very low ADR may show broad selling, but it does not automatically mean the market is ready to bounce.
That is why ADR works better with confirmation. Price trend, sector strength, volume, volatility, and derivative data can all add context. Trading involves market risk, and no breadth indicator can remove uncertainty or promise an outcome.
FAQs
What does an advance decline ratio above 1 mean?
An advance decline ratio above 1 means more stocks advanced than declined during the measured period. It usually suggests positive market breadth, but it should be read with price trend and volume.
What does an advance decline ratio below 1 mean?
An advance decline ratio below 1 means more stocks declined than advanced. It usually points to weak breadth or broader selling pressure.
Is the advance decline ratio a buy or sell signal?
No. ADR is a market breadth indicator, not a direct buy or sell signal. It helps us understand participation in a market move, but trade decisions need broader analysis and risk controls.
How is ADR different from the advance decline line?
ADR divides advancing stocks by declining stocks for a ratio. The advance decline line usually tracks the cumulative difference between advancing and declining stocks over time.
Can ADR be used for intraday trading?
Yes, traders can use advance and decline data intraday if the data source supports it. For intraday use, ADR should be read with price action, volume, volatility, and the trader’s risk plan.
Disclaimer: The information provided in this blog is for educational and informational purposes only and should not be construed as investment advice, financial advice, or a recommendation to buy, sell, or hold any securities or financial products. Investments in the securities market are subject to market risks. Please read all related documents carefully before investing. Readers should conduct their own research and consult a SEBI-registered investment adviser or other qualified financial professional before making any investment decisions. Past performance is not indicative of future results.