A ₹10 move can look dramatic on one stock and ordinary on another. Before we judge the move, we need to understand how widely that stock’s price has been moving. Average True Range, or ATR, helps us put that movement in context. ATR measures price volatility by averaging the true range over a chosen number…
A ₹10 move can look dramatic on one stock and ordinary on another. Before we judge the move, we need to understand how widely that stock’s price has been moving. Average True Range, or ATR, helps us put that movement in context.
ATR measures price volatility by averaging the true range over a chosen number of periods. It includes gaps from the previous close. We can use it to assess recent price ranges and explore stop distances or position sizes, but it cannot tell us whether the next move will be up or down.
What is Average True Range?
Developed by J. Welles Wilder, ATR expresses volatility in the same units as the underlying price. For an Indian stock, that usually means rupees. For an index, it means points.
Suppose a stock has a daily ATR of ₹12. We can read that as a smoothed measure of its recent daily true ranges. It does not mean the stock gains ₹12 each day, or that tomorrow’s movement will stay within ₹12.
That distinction matters when we look at a falling market. ATR can rise during a sharp sell-off just as it can during a rally. It measures the size of price ranges, without assigning a bullish or bearish direction.
Why Does ATR use True Range?
A day’s high minus its low tells us the range within that session. It can miss a gap between yesterday’s close and today’s trading prices.
Imagine a stock closes at ₹500, then trades between ₹510 and ₹518 the next day. Its intraday range is only ₹8. Measured from the previous close, however, the price has reached ₹18 higher.
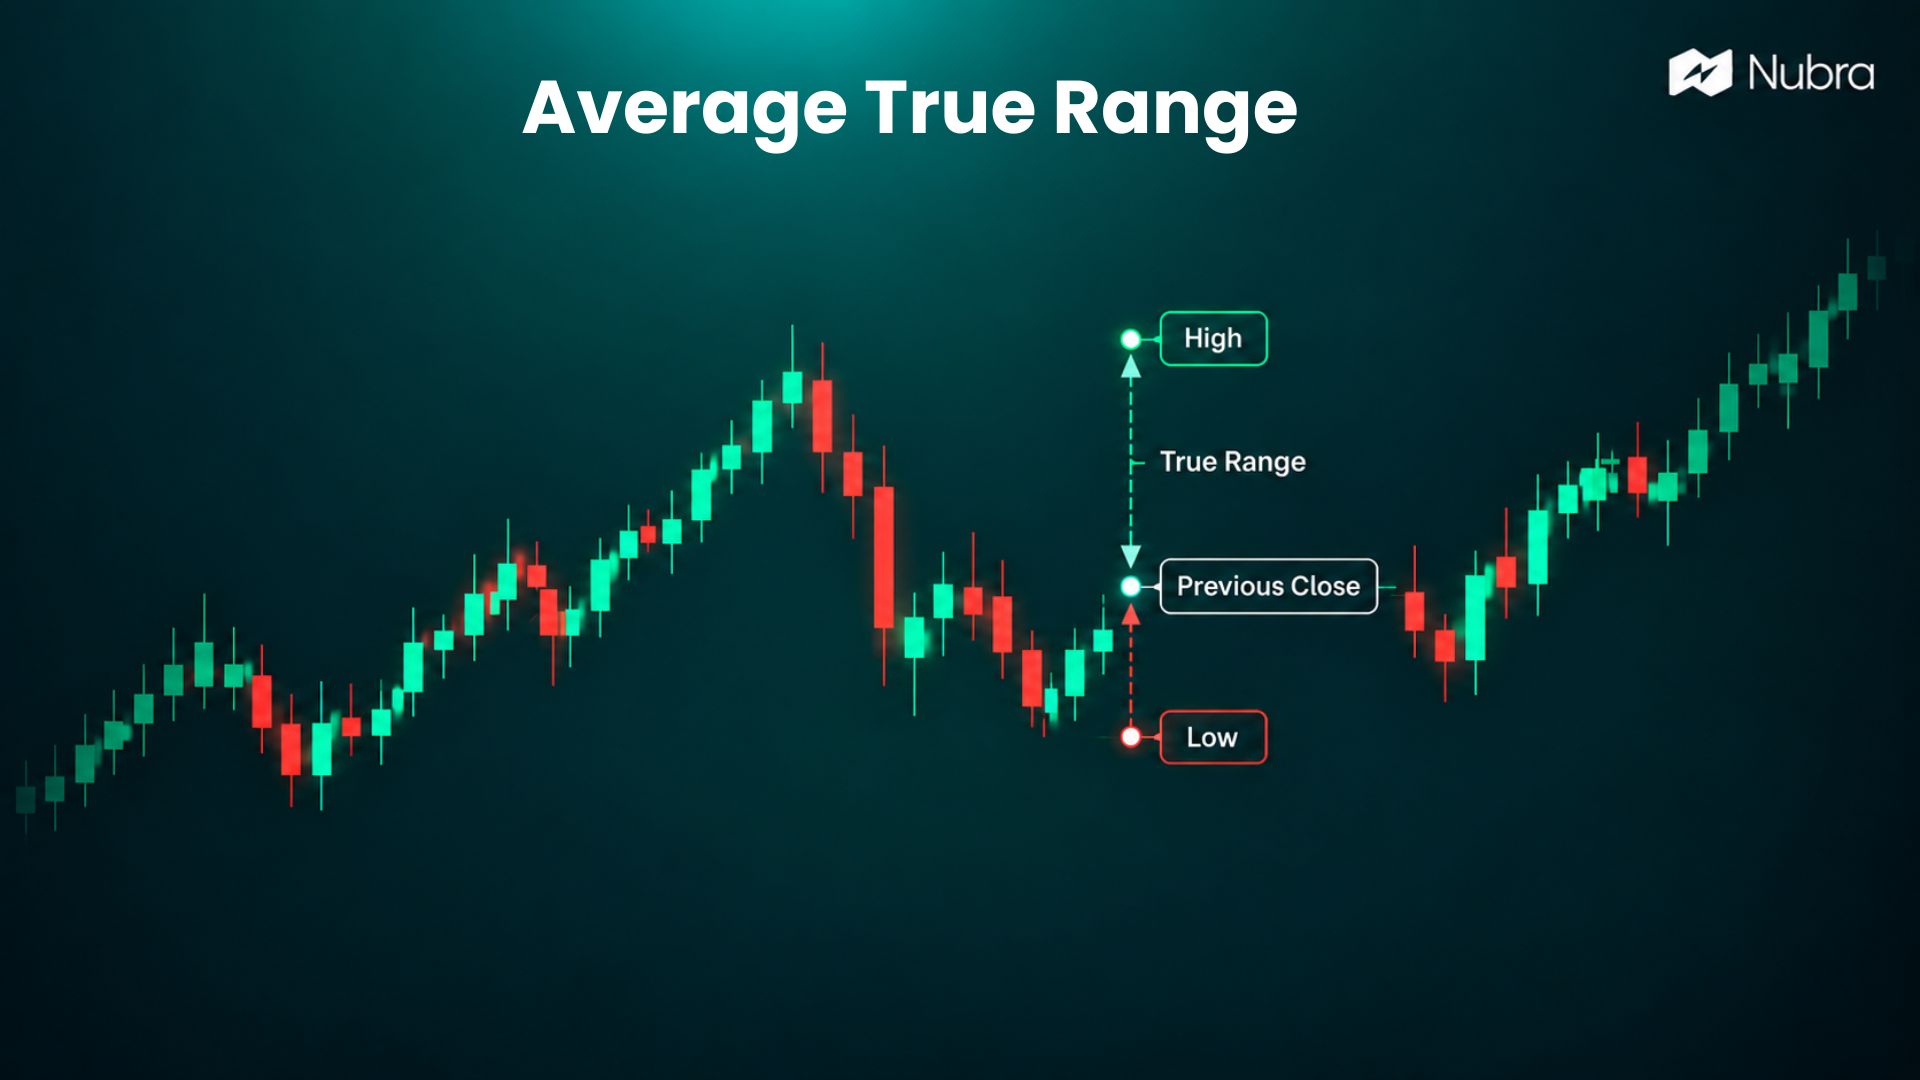
True range captures that difference. We calculate three values and take the largest:
- Current high − current low.
- Absolute difference between the current high and the previous close.
- Absolute difference between the current low and the previous close.
“Absolute difference” means we use the size of the difference without a plus or minus sign.
For our example, the calculations are ₹518 − ₹510 = ₹8, |₹518 − ₹500| = ₹18, and |₹510 − ₹500| = ₹10. The true range is therefore ₹18, not ₹8.
We follow the same process for a gap down. Using only the candle’s high and low would leave part of that price movement out of our calculation.
How Do We Calculate Average True Range?
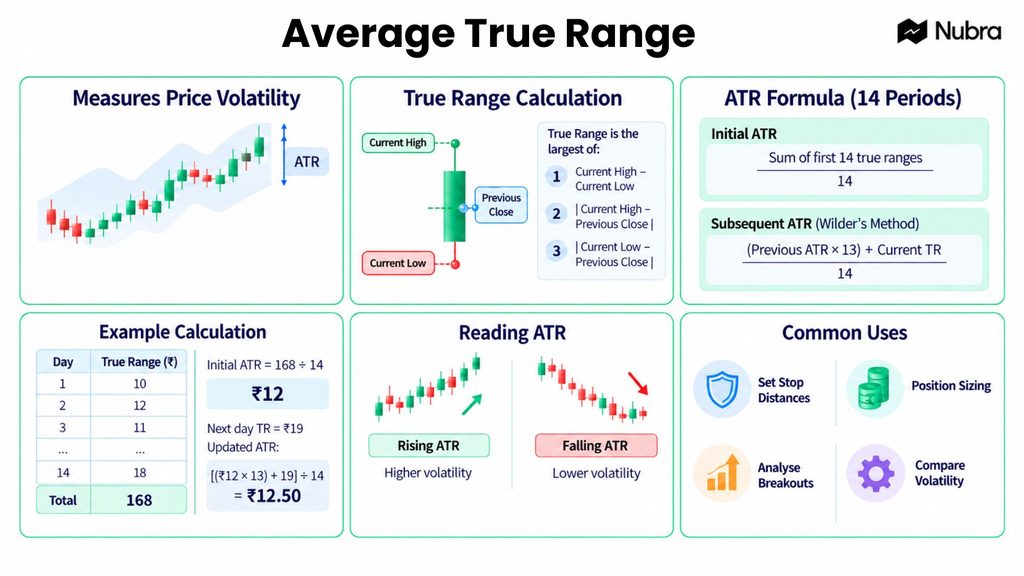
A common ATR setting is 14 periods. We first calculate true range for each period, then establish the initial average. After that, Wilder’s method updates the previous ATR with the newest true range.
Step 1: Calculate the initial ATR
Initial ATR = Sum of the first 14 true ranges ÷ 14
Suppose our hypothetical stock has these daily true ranges, in rupees:
10, 12, 11, 13, 9, 14, 12, 10, 11, 13, 12, 10, 13, 18.
They total ₹168, so the initial ATR is ₹168 ÷ 14 = ₹12. These are invented values for explaining the calculation, not observations or a stock recommendation.
Step 2: Update the ATR
For subsequent periods, we use:
Current ATR = [(Previous ATR × 13) + Current true range] ÷ 14
If the next day’s true range is ₹19, the updated ATR becomes:
[(₹12 × 13) + ₹19] ÷ 14 = ₹175 ÷ 14 = ₹12.50.
The latest range was wider, so ATR increased. It did not jump straight to ₹19 because the earlier reading still carries weight.
For a different period setting, replace 14 with the chosen number of periods and 13 with that number minus one. Wilder’s ongoing calculation is a smoothed average; it is not a fresh simple average of only the latest 14 readings.
How Do We Read ATR on a Chart?
We get more meaning from a reading when we compare it with the same instrument’s earlier values, using the same settings.
If daily ATR rises from ₹8 to ₹14, recent true ranges have expanded. If it falls from ₹14 to ₹8, they have narrowed. Neither change tells us whether the stock is becoming a better trade.
Comparing raw ATR across differently priced stocks can also mislead us. Consider two hypothetical stocks:
- Stock A closes at ₹200 and has an ATR of ₹6.
- Stock B closes at ₹2,000 and has an ATR of ₹20.
Stock B has the larger rupee range. To compare ranges relative to price, we can calculate ATR percentage = ATR ÷ closing price × 100.
That gives Stock A an ATR percentage of 3% and Stock B 1%. Stock A has the larger price-relative range despite its smaller rupee ATR. We still need matching timeframes and calculation settings for a useful comparison.
How Can We use ATR in a Trading Plan?
ATR gives us a way to connect recent volatility with a planned trade. The examples below illustrate the mechanics; they do not recommend a particular stop, position size or trading strategy.
Assessing a stop distance
Suppose a hypothetical share entry is ₹500 and daily ATR is ₹12. A stop-distance model using twice ATR would place the reference level ₹24 below entry, at ₹476.
We can now ask whether that distance fits the trade’s logic and planned risk. The multiple is an assumption to evaluate, not a universal rule.
A wider stop also means more potential loss per share. Simply moving the stop farther away while keeping the same quantity increases the amount at risk. Gaps and execution differences can also make the eventual loss larger than the planned stop distance suggests.
Connecting distance with position size
Continuing the example, suppose our hypothetical risk budget is ₹1,200 and the entry-to-stop distance is ₹24 per share.
Illustrative quantity = ₹1,200 ÷ ₹24 = 50 shares.
If the distance increases to ₹30, the same calculation gives 40 shares. This shows how a wider stop and a smaller position can work together within a fixed planned risk amount.
The arithmetic excludes charges and slippage, meaning the difference between the expected execution price and the actual price. It is not a maximum-loss guarantee. We also cannot carry a share-quantity calculation straight into F&O without accounting for contract specifications and lot sizes.
Putting a breakout in context
Suppose a stock moves above a level it has repeatedly struggled to cross. If ATR rises too, we can see that the move comes with expanding price ranges.
That is context, not proof that the breakout will continue. We still need to examine the price behaviour itself. A large reversal can increase ATR as well, so treating every rise in the indicator as confirmation would confuse volatility with direction.
Which ATR Settings Should We use?
We start by identifying the chart timeframe. A 14-period ATR on a daily chart uses daily bars; on a five-minute chart, it uses five-minute bars. Those readings describe different scales of movement.
A shorter lookback responds more quickly to recent changes. A longer one smooths more of the variation. Neither setting is universally suitable, and changing settings until a past trade looks successful can give us a misleading impression.
Calculation methods can differ too. Some charting tools offer Wilder’s smoothing alongside other averages. Before comparing readings, we check the timeframe, period and smoothing method.
Bringing Volatility into Our Analysis
ATR helps us ask a more precise question: how wide have recent price ranges been, and what does that imply for our plan? We still need to assess direction, execution and risk separately.
As we build that understanding, we can explore Nubra and its trading resources alongside our wider chart analysis. An indicator adds information to the process; it does not remove uncertainty from the next trade.
FAQs
What is a good ATR value?
There is no universal good value. We compare ATR with the instrument’s own history and consider its price and chart timeframe. A higher number is not automatically preferable.
Can we use ATR for intraday trading?
Yes. ATR can be calculated on intraday bars. We need to keep the timeframe clear: a five-minute ATR and a daily ATR describe different ranges and are not interchangeable.
Does a rising ATR mean prices will rise?
No. Rising ATR indicates expanding true ranges. Those ranges can accompany upward moves, downward moves or reversals, so we assess direction from price behaviour separately.
How is ATR different from RSI?
ATR measures the size of price ranges. The Relative Strength Index, or RSI, measures momentum through recent gains and losses. They answer different questions; neither removes the need for a risk plan.
Disclaimer: The information provided in this blog is for educational and informational purposes only and should not be construed as investment advice, financial advice, or a recommendation to buy, sell, or hold any securities or financial products. Investments in the securities market are subject to market risks. Please read all related documents carefully before investing. Readers should conduct their own research and consult a SEBI-registered investment adviser or other qualified financial professional before making any investment decisions. Past performance is not indicative of future results.