A falling wedge pattern forms when price makes lower highs and lower lows between two downward-sloping lines that gradually move closer together. It has a bullish bias, but we look for a break above the upper line before interpreting it as a bullish signal. The useful clue is the narrowing range: price is still falling,…
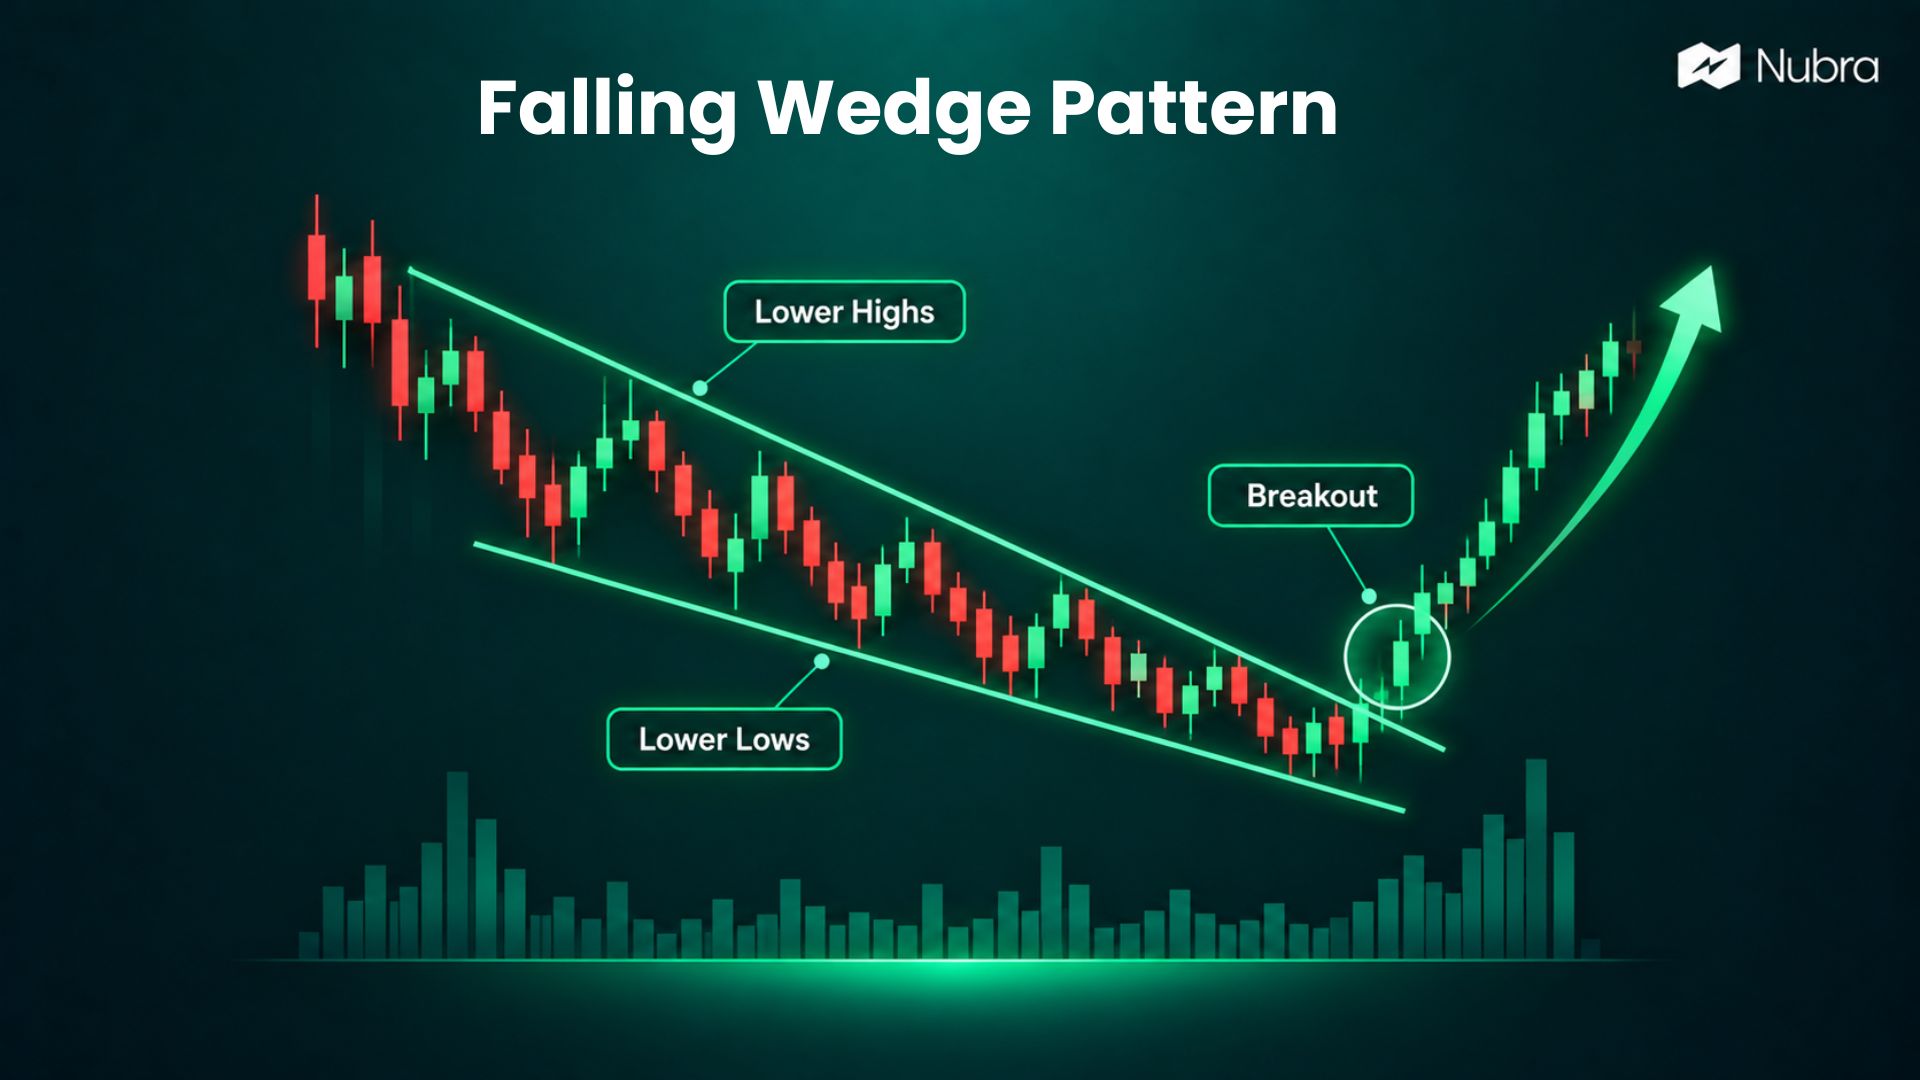
A falling wedge pattern forms when price makes lower highs and lower lows between two downward-sloping lines that gradually move closer together. It has a bullish bias, but we look for a break above the upper line before interpreting it as a bullish signal.
The useful clue is the narrowing range: price is still falling, yet the decline may be losing momentum. That gives us a setup to study, not a promise of a recovery.
How Do We Identify a Falling Wedge?
We start by connecting successive highs to draw resistance, the upper boundary. Connecting successive lows gives us support, the lower boundary.
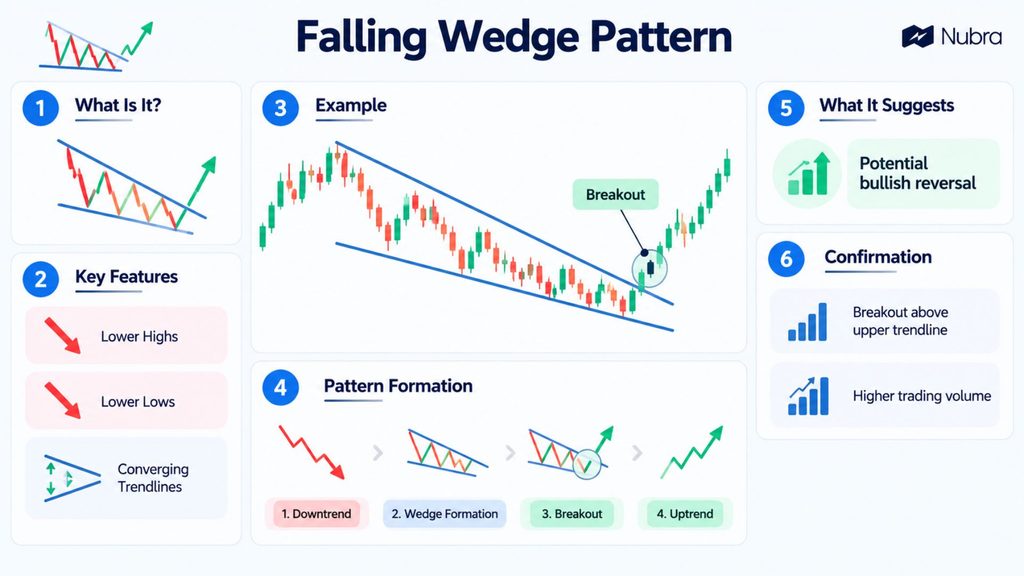
Three features help us read the shape:
- Both lines slope down, with resistance falling more steeply than support.
- The gap between the lines narrows as the pattern develops.
- Trading volume often eases during the formation; stronger volume on an upward breakout adds supporting evidence.
We need several clear turning points to judge the structure. Two isolated candles are not enough to establish a meaningful wedge. If the lines stay parallel, we are looking at a descending channel instead.
Is It a Reversal or Continuation Pattern?
The preceding trend gives us the distinction.
After a downtrend, a falling wedge can develop into a bullish reversal if price breaks above resistance. Within a broader uptrend, the same downward-sloping shape can represent a temporary pullback, with an upward breakout suggesting continuation.
In both cases, we separate the shape from confirmation. A narrowing decline alone does not show that buyers have taken control.
How Do We Interpret the Breakout?
We look for a candle close above resistance on the timeframe being studied. A brief move above the line that disappears before the close offers weaker evidence. Higher trading volume can strengthen the interpretation, but it cannot rule out failure.
Some traders study the breakout itself; others wait for price to return to the broken resistance line and see whether it holds as support. This retest may never happen. A move back inside the wedge weakens the bullish reading.
For a hypothetical Indian stock, imagine resistance near ₹490 and a candle closing at ₹495. We would then examine volume, nearby resistance and the recent low. The ₹495 close alone does not tell us whether the potential upside justifies the risk.
When evaluating a possible trade, we also consider position size and where the setup would fail. A stop-loss does not guarantee an exit at the planned price: gaps and slippage can increase losses. These checks belong alongside pattern recognition.
Bringing the Analysis Together
Use Nubra Charts to review the wedge boundaries, breakout and any retest. For an options setup, Nubra Option Chain provides strike-level open interest, implied volatility and Greeks, while Nubra Strategy Builder helps compare payoff scenarios. These tools support analysis and risk review; they do not make a chart pattern predictive or guarantee an outcome.
FAQs
Is a falling wedge bullish or bearish?
It is generally a bullish formation despite its downward slope. We still need breakout confirmation, and price can move against that interpretation.
Does a falling wedge guarantee a rally?
No. Breakouts can fail. We assess the broader trend, volume and nearby resistance rather than relying on the shape alone.
How is a falling wedge different from a descending channel?
A falling wedge has downward-sloping boundaries that move closer together. A descending channel has roughly parallel boundaries, so its width stays more consistent.
What helps confirm a falling wedge breakout?
A close above the upper trendline supports a breakout interpretation. Increased trading volume can add support, although neither prevents the breakout from failing.
Can a falling wedge form during an uptrend?
Yes. It can form during a pullback within an uptrend and act as a continuation pattern. After a downtrend, it may instead suggest a possible reversal.
Does price always retest a falling wedge after a breakout?
No. Price may return to the broken trendline, continue rising without a retest, or fall back inside the wedge. A retest is possible, not guaranteed.
Disclaimer: The information provided in this blog is for educational and informational purposes only and should not be construed as investment advice, financial advice, or a recommendation to buy, sell, or hold any securities or financial products. Investments in the securities market are subject to market risks. Please read all related documents carefully before investing. Readers should conduct their own research and consult a SEBI-registered investment adviser or other qualified financial professional before making any investment decisions. Past performance is not indicative of future results.