When we study a price chart, we can see where a stock has moved. The Money Flow Index (MFI) adds another question: how does trading volume affect the strength of that move? MFI combines price and volume to estimate buying and selling pressure on a scale from 0 to 100. We can use it to…

When we study a price chart, we can see where a stock has moved. The Money Flow Index (MFI) adds another question: how does trading volume affect the strength of that move?
MFI combines price and volume to estimate buying and selling pressure on a scale from 0 to 100. We can use it to study stretched conditions and changes in momentum, while keeping the price chart in view.
What Does The Money Flow Index Tell Us?
MFI is a momentum oscillator: an indicator that moves within a fixed range. It gives more weight to periods with greater trading volume. That helps us examine participation behind price changes.
The phrase “money flow” can be misleading. We are working with a calculation based on price and volume, rather than tracking actual deposits or identifying who bought the stock. An MFI reading cannot tell us that institutions are accumulating shares.
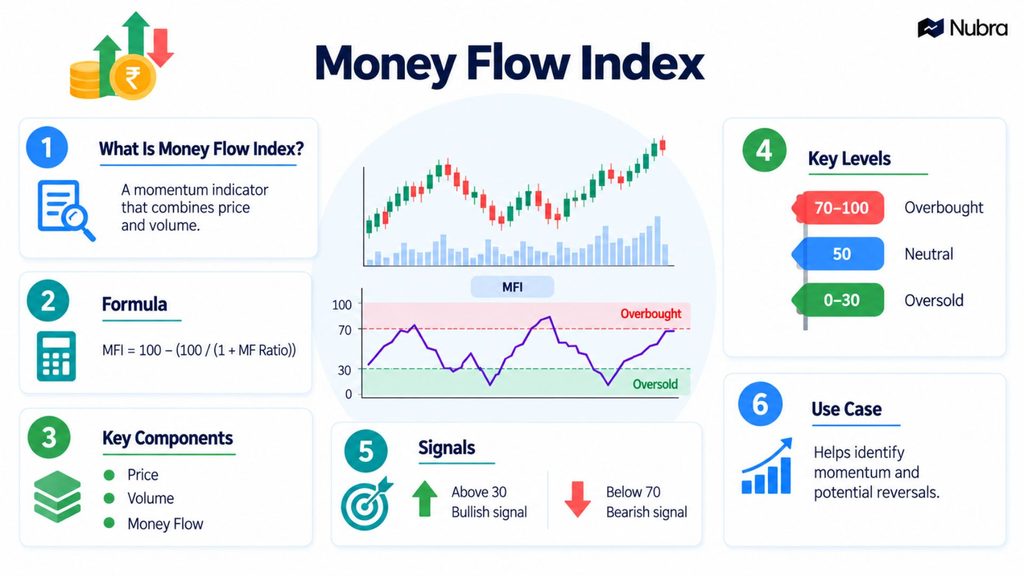
How Do We Calculate MFI?
A common setting is 14 periods. On a daily chart, that means 14 trading sessions; on a five-minute chart, it means 14 five-minute candles. We use the same timeframe throughout the calculation.
Step 1: Calculate Typical Price
We average each period’s high, low and closing price:
Typical price = (High + Low + Close) ÷ 3
Step 2: Calculate And Classify Raw Money Flow
Raw money flow = Typical price × Volume
We compare typical price with the previous period. A rise puts that period’s raw money flow in the positive total; a fall puts it in the negative total. If typical price is unchanged, we leave its flow out of both totals.
“Negative” is a category here. We add those flow amounts as positive magnitudes in the denominator, not as minus numbers.
Step 3: Calculate The Ratio And Index
We sum each category over the latest 14 periods:
Money flow ratio = Positive money flow total ÷ Negative money flow total
MFI = 100 − [100 ÷ (1 + Money flow ratio)]
These are the standard calculation steps described in StockCharts’ MFI guide.
A Simple Rupee-Based Example
Suppose a stock’s high is ₹510, low is ₹490 and close is ₹500. Its typical price is ₹500. With volume of 20,000 shares, raw money flow is ₹1 crore.
If the previous period’s typical price was ₹495, we classify that ₹1 crore as positive flow. If it was ₹505, the same amount goes into negative flow.
Now assume our full 14-period totals are ₹6 crore positive and ₹3 crore negative. The ratio is 2, so:
MFI = 100 − [100 ÷ 3] = 66.67
This hypothetical reading means positive flow outweighed negative flow in our sample. It does not mean a 66.67% chance of a price rise.
How Do We Interpret MFI Signals?
Overbought And Oversold Levels
The conventional thresholds are above 80 for overbought and below 20 for oversold. We read these as signs of stretched buying or selling pressure.
An overbought stock can keep rising. An oversold stock can keep falling. Fidelity’s indicator guide makes this distinction clear: extreme readings alone are insufficient reasons to buy or sell.
For example, if MFI reaches 84 during an uptrend, we can examine whether price still holds its recent support area. Automatically treating 84 as an exit signal skips the chart context that gives the reading meaning.
Bullish And Bearish Divergence
Divergence appears when price and MFI form different patterns:
- Bullish divergence: price makes a lower low, while MFI makes a higher low. Selling pressure may be easing.
- Bearish divergence: price makes a higher high, while MFI makes a lower high. Buying pressure may be weakening.
Imagine a stock falls from ₹500 to ₹480, then later reaches ₹470. If MFI rises from 18 at the first low to 26 at the second, we have bullish divergence. The price has fallen further, but MFI has not followed it lower.
We still need to see what price does next. A divergence may persist without a reversal, so it gives us a reason to investigate rather than a ready-made trade.
Failure Swings
A failure swing is a pattern within MFI itself. In a bullish example, MFI falls below 20, rebounds above 20, pulls back without dropping below 20, then exceeds its previous rebound high.
Unlike divergence, this sequence does not require a matching price pattern. We can study it as another sign of changing momentum, without assuming it guarantees a reversal. TradingView explains the sequence in its indicator documentation.
Money Flow Index vs RSI
We often compare MFI with the Relative Strength Index because both run from 0 to 100. The distinction is in their inputs:
| Feature | MFI | RSI |
| Inputs | Typical price and trading volume | Price changes, usually closing prices |
| Focus | Buying and selling pressure weighted by volume | Strength of price momentum |
| Volume included? | Yes | No |
Neither is inherently superior. We choose based on the information we want to examine, as CMC Markets’ comparison explains. Agreement between two related indicators also gives us no certainty about the next move.
Bringing MFI Into Our Chart Analysis
Before interpreting MFI, we check the instrument, timeframe and volume feed. Missing or unsuitable volume data weakens the basis of a volume-dependent calculation.
We can then examine MFI alongside the trend and nearby support or resistance. Support is an area where declines have previously met buying interest; resistance is where advances have met selling interest. Neither level is certain to hold. Writing down what would contradict our interpretation helps us avoid defending a signal after the chart has changed.
We can use Nubra Charts to review price structure alongside MFI. If we are assessing an options setup, Nubra Option Chain provides strike-level open interest, implied volatility and Greeks, and Nubra Strategy Builder supports payoff-scenario review. These tools add context; an MFI reading alone does not establish a trade’s suitability.
FAQs
What is The Usual MFI Setting?
Fourteen periods is a common default. We should distinguish the number of candles from their duration: 14 daily candles cover a different window from 14 intraday candles.
Does MFI Below 20 Mean We Should Buy?
No. It indicates an oversold condition under conventional settings. We still need price context, and the decline may continue.
Does MFI Show Actual Money Entering A Stock?
No. We calculate it from price and volume. It does not identify investors or measure net cash deposits into the stock.
How Does MFI Differ From RSI?
MFI uses both price and trading volume, while RSI usually uses changes in closing prices. Both measure momentum, but MFI adds volume to the calculation.
What Is A Bullish MFI Divergence?
It occurs when price makes a lower low while MFI makes a higher low. This can suggest easing selling pressure, but it does not guarantee a price reversal.
Does MFI Above 80 Mean We Should Sell?
No. A reading above 80 is conventionally considered overbought, but a strong uptrend can continue. We check price action and nearby resistance before drawing conclusions.
Disclaimer: The information provided in this blog is for educational and informational purposes only and should not be construed as investment advice, financial advice, or a recommendation to buy, sell, or hold any securities or financial products. Investments in the securities market are subject to market risks. Please read all related documents carefully before investing. Readers should conduct their own research and consult a SEBI-registered investment adviser or other qualified financial professional before making any investment decisions. Past performance is not indicative of future results.