A dead cat bounce is a temporary rise in a stock or other asset after a sharp fall, followed by another decline. When we see prices recover after a sell-off, the key question is whether the recovery can last. The phrase describes a rebound that fails to change the broader downward trend. Its unusual name…
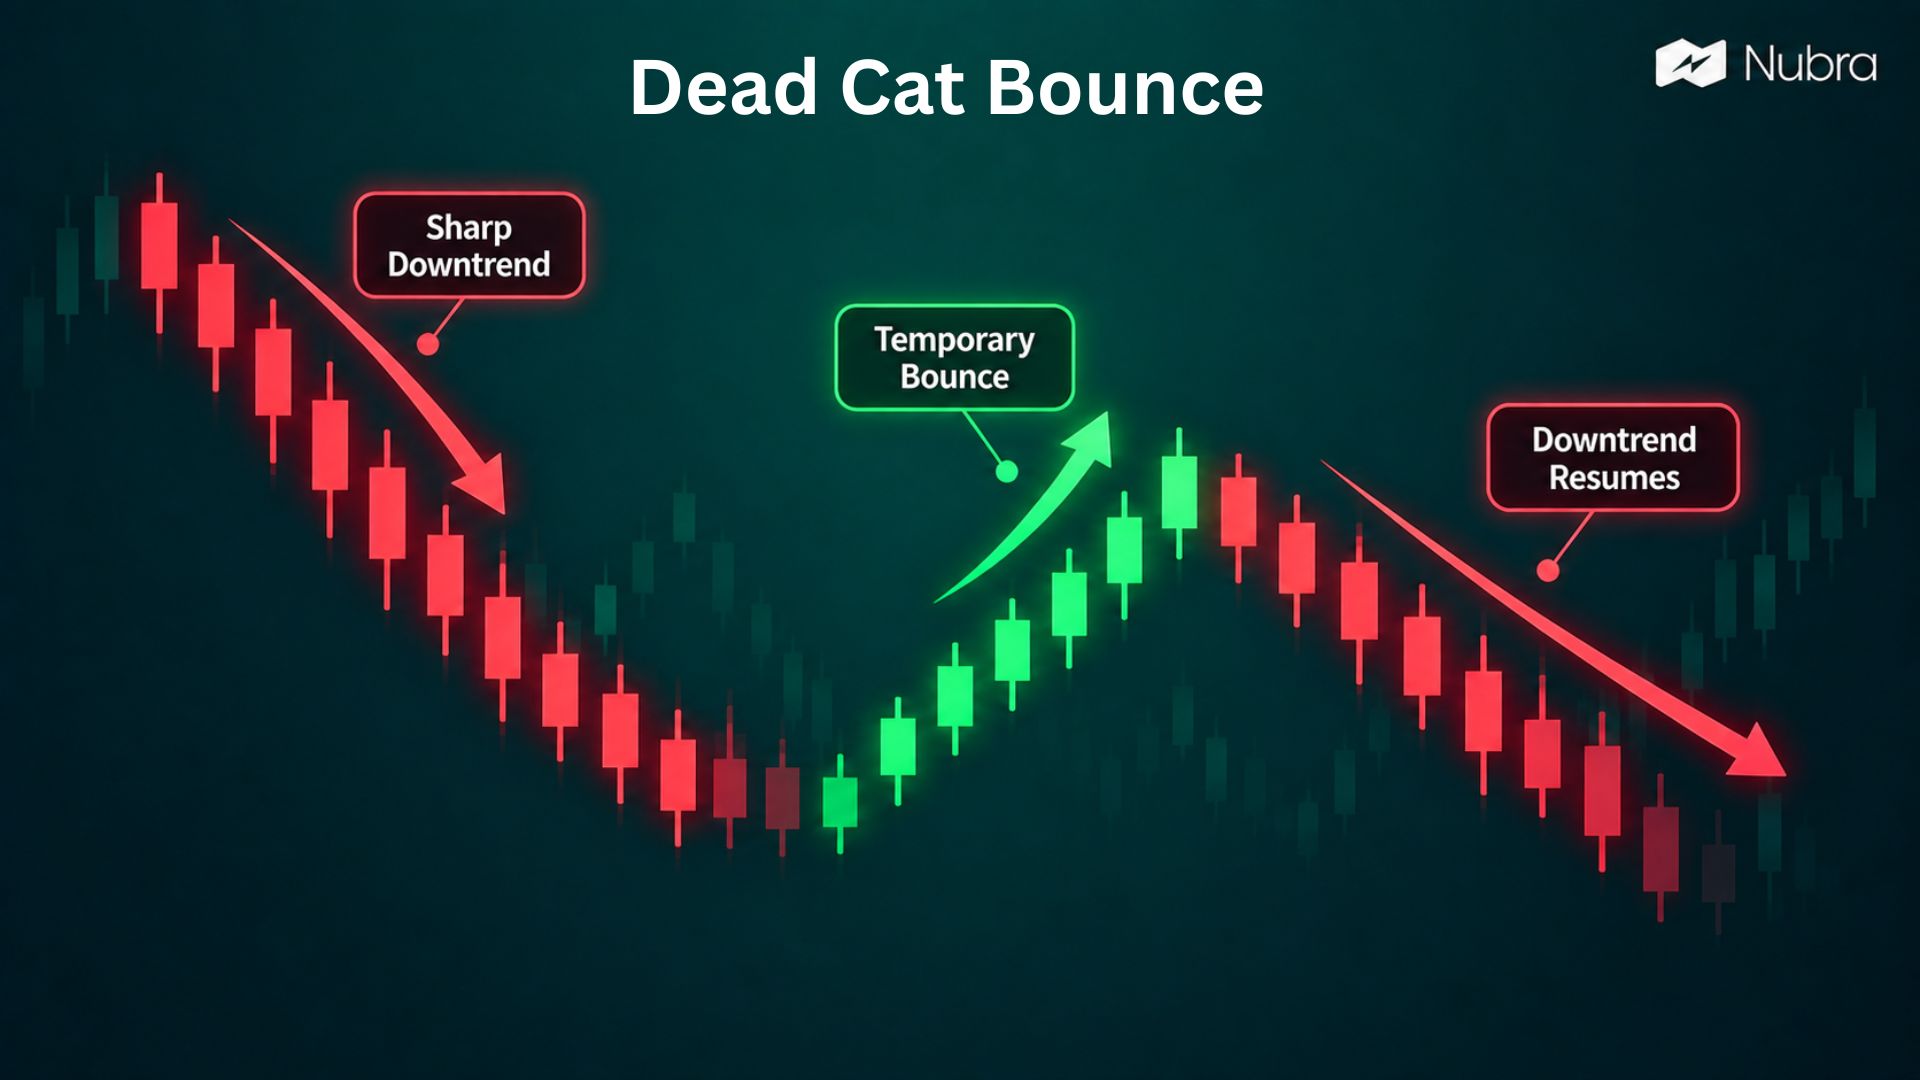
A dead cat bounce is a temporary rise in a stock or other asset after a sharp fall, followed by another decline. When we see prices recover after a sell-off, the key question is whether the recovery can last.
The phrase describes a rebound that fails to change the broader downward trend. Its unusual name comes from the idea that even something dropped from a great height can bounce without recovering.
For our analysis, the distinction matters: a rising price alone does not establish that the decline has ended.
Why Does A Dead Cat Bounce Happen?
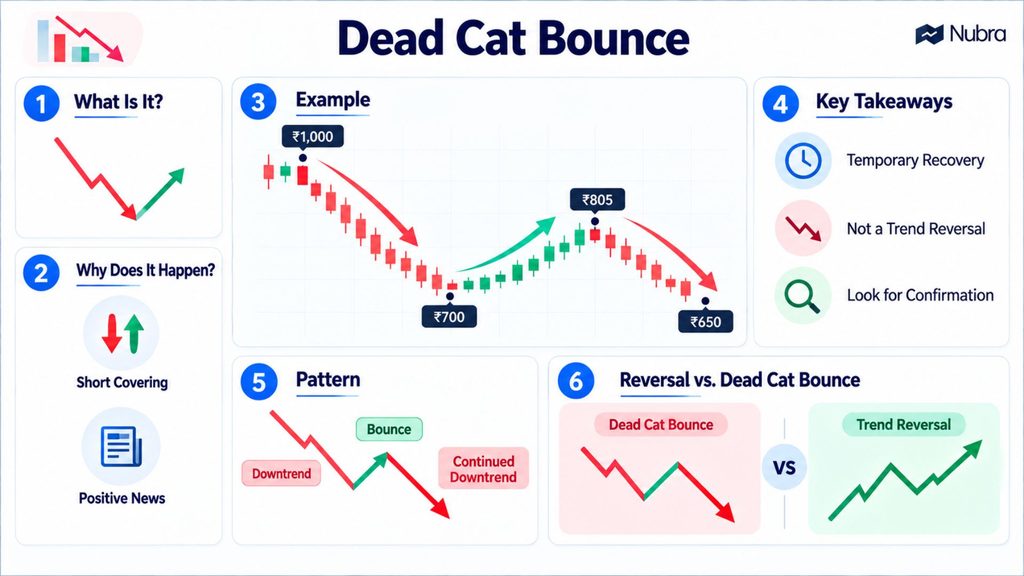
A rebound can begin when traders close short positions, which are positions taken to benefit from falling prices. Buying back shares to close those positions adds demand. Other participants may see value in the stock after its decline.
Positive news can also lift sentiment without resolving the problem behind the original fall. We therefore need to separate the reason for the rebound from the reason for the earlier selling. A new announcement may attract buyers while weak business conditions remain unchanged. These are possible drivers, not proof that a rally will fail.
A Simple Dead Cat Bounce Example
Suppose we follow a hypothetical Indian stock that falls from ₹1,000 to ₹700, then rebounds to ₹805. That is a 15% rise from the low, but the stock remains below its starting price.
If it subsequently falls to ₹650, the intervening rally fits a dead cat bounce: a fall, a recovery, then a renewed decline. At ₹805, however, we could not know that ₹650 would follow. This example illustrates the pattern; it is not a forecast or a trading recommendation.
Dead Cat Bounce Versus a Trend Reversal
A dead cat bounce interrupts a decline. A sustained reversal changes the direction of the trend. The difference becomes clearer with hindsight.
When we assess a rebound, we can examine whether prices move above earlier peaks and whether subsequent pullbacks hold above previous lows. We can also compare trading volume, the number of shares traded, with the activity during the decline.
A rally that stalls near resistance, an area where selling has previously limited price gains, may warrant caution. Stronger participation and improving business conditions may support the case for recovery. Neither provides certainty.
Our interpretation should remain open to new evidence. Calling every rebound a dead cat bounce can be just as misleading as treating every upward move as a lasting recovery.
Putting The Rebound in Context
We get more context by reviewing the preceding decline and subsequent price action together. One strong session cannot settle the question. Chart patterns help organise observations; they do not tell us what must happen next.
Use Nubra Charts to compare the rebound with the preceding decline and nearby price levels. If assessing an options position, review the relevant underlying and expiry in Nubra Option Chain and compare payoff scenarios in Nubra Strategy Builder. These tools support analysis, but cannot establish with certainty whether a rebound will hold.
FAQs
How Long Does a Dead Cat Bounce Last?
There is no fixed duration. A rebound may last days or weeks; its defining feature is the renewed decline, not a set time limit.
Is a Dead Cat Bounce Bullish or Bearish?
The rebound moves upward, but the completed pattern sits within a continuing decline. We should not treat the label alone as a buy or sell signal.
What Can Cause a Dead Cat Bounce?
Short sellers closing positions, bargain buying or favourable news can briefly lift prices after a sharp fall. That rebound may fade if the reasons for the decline remain.
How Does a Dead Cat Bounce Differ From a Trend Reversal?
A dead cat bounce ends with a renewed decline. A reversal is a more lasting change in direction, often accompanied by higher highs and higher lows. We cannot confirm either from one rebound.
Can We Identify a Dead Cat Bounce as soon as Prices Rise?
No. The pattern becomes clear only after the rebound fails and the decline resumes. While prices are rising, it remains a possible explanation rather than a confirmed pattern.
Does High Trading Volume Rule out a Dead Cat Bounce?
No. Strong volume can show interest in a rebound, but it does not guarantee that the recovery will last. We also check price structure and the broader trend.
Disclaimer: The information provided in this blog is for educational and informational purposes only and should not be construed as investment advice, financial advice, or a recommendation to buy, sell, or hold any securities or financial products. Investments in the securities market are subject to market risks. Please read all related documents carefully before investing. Readers should conduct their own research and consult a SEBI-registered investment adviser or other qualified financial professional before making any investment decisions. Past performance is not indicative of future results.