A break of structure (BOS) occurs when price breaks a significant swing level in the direction of an existing trend. In an uptrend, that means moving above a previous swing high; in a downtrend, below a previous swing low. We use BOS to read how a trend is developing. It does not tell us what…
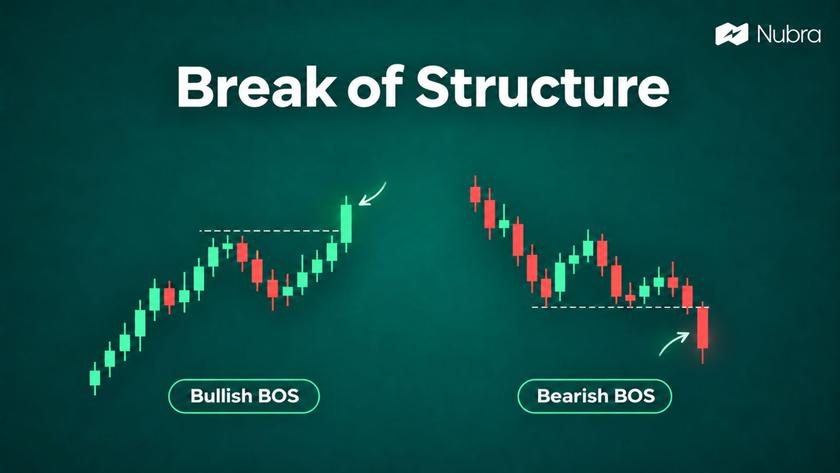
A break of structure (BOS) occurs when price breaks a significant swing level in the direction of an existing trend. In an uptrend, that means moving above a previous swing high; in a downtrend, below a previous swing low.
We use BOS to read how a trend is developing. It does not tell us what price will do next or provide a complete trading plan. Here, we require a candle close beyond the level, rather than a brief move through it.
How We Recognise Market Structure
Market structure is the sequence of peaks and troughs on a price chart. A swing high is a local peak; a swing low is a local trough.
An uptrend forms higher highs and higher lows. A downtrend forms lower highs and lower lows. When neither sequence is clear, the market may be moving sideways, making directional labels less useful.
We mark meaningful turning points on one timeframe before looking for a break. Labelling every small fluctuation can make a choppy chart appear to contain several competing trends. Nubra’s guide to trading patterns in charts adds context to these price movements.
Bullish and Bearish BOS Examples
Bullish Break of Structure
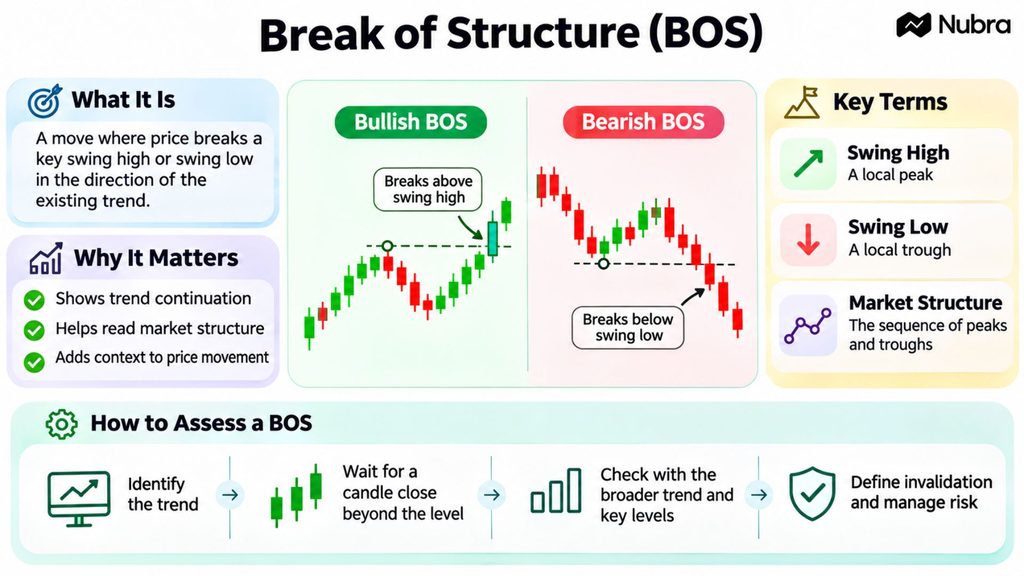
Suppose a hypothetical stock rises from ₹100 to ₹110, pulls back to ₹105, then closes at ₹112 on our chosen timeframe.
The ₹105 trough is a higher low than ₹100. The close above ₹110 creates a bullish BOS within the upward sequence. We have evidence that the trend has extended, without assurance that the next move will be higher.
Bearish Break of Structure
Now suppose a stock falls from ₹200 to ₹185, rebounds to ₹192, then closes at ₹182.
The rebound forms a lower high below ₹200, followed by a close beneath ₹185. That is a bearish BOS within the downward sequence. A later recovery could still invalidate a continuation view.
Both examples are illustrative, rather than current market prices or trade recommendations.
How We Assess a Break of Structure
1. Identify the trend and mark the relevant swing high or low.
2. Wait for the candle to close beyond that level on the selected timeframe.
3. Compare the move with the broader trend and nearby support or resistance.
4. Consider what would invalidate the view, alongside position size and execution risk.
A wick above resistance followed by a close back below it does not meet our close-based rule. Nubra’s candlestick patterns guide explains how candle bodies and wicks describe price movement.
Even a qualifying close can fail. A retest may offer more information, but price need not return to the broken level. We also avoid treating a five-minute bullish BOS as proof that a daily downtrend has ended.
BOS Versus Change of Character
A BOS describes continuation in the existing trend’s direction. A change of character (CHoCH) describes an initial break against that trend.
For example, an uptrend breaking above its previous high may form a bullish BOS. Breaking below the higher low that supported the upward sequence may instead be labelled a bearish CHoCH.
Terminology varies across trading methods. We define the swing, timeframe and confirmation rule first; neither label guarantees continuation or reversal. A chart pattern alone also cannot establish who placed the orders behind a move.
Using Nubra Tools Alongside BOS Analysis
Once the price structure is clear, we can use Nubra Charts through the chart analyser to study the selected instrument. Our Option Chain provides strike-wise information such as open interest, volume and Greeks for options analysis.
For multi-leg scenario planning, our Strategy Builder helps model potential payoffs. Sign-in is required for the chart analyser and strategy builder.
These tools support analysis; they do not validate a BOS automatically or guarantee outcomes. An underlying asset’s bullish break does not guarantee a call option will gain value. Time decay and changes in implied volatility can affect the premium too.
FAQs
What Does BOS Stand for in Trading?
BOS stands for break of structure. In this guide, it means a candle close beyond a significant swing level in the existing trend’s direction.
Does a Wick Count as a BOS?
Under our close-based rule, a wick alone does not qualify. Other methods use different rules, so consistency matters when reviewing charts.
Does BOS Mean the Trend Will Continue?
No. It records an extension of the existing structure. Price can reverse or return to a range after the break.
Which Timeframe Should We Use for BOS?
There is no universally best timeframe. We choose one that matches the analysis horizon and check how its structure relates to higher timeframes.
Can We Use BOS as an Entry Signal?
BOS alone does not define an entry, exit or position size. Any trading approach also needs rules for risk, invalidation and execution.
How is BOS Different From a Breakout?
A breakout broadly describes price moving beyond a level or range. BOS specifically relates that move to a significant swing within market structure.
Disclaimer: The information provided in this blog is for educational and informational purposes only and should not be construed as investment advice, financial advice, or a recommendation to buy, sell, or hold any securities or financial products. Investments in the securities market are subject to market risks. Please read all related documents carefully before investing. Readers should conduct their own research and consult a SEBI-registered investment adviser or other qualified financial professional before making any investment decisions. Past performance is not indicative of future results.