A relative rotation graph, or RRG, compares the relative strength and momentum of stocks, sectors or other instruments against a benchmark. We can see which groups are leading, which are falling behind, and how their positions have changed. For Indian sector analysis, we can use an RRG to compare relative trends before examining individual price…
A relative rotation graph, or RRG, compares the relative strength and momentum of stocks, sectors or other instruments against a benchmark. We can see which groups are leading, which are falling behind, and how their positions have changed.
For Indian sector analysis, we can use an RRG to compare relative trends before examining individual price charts.
Relative strength does not mean a positive return. A sector can outperform a falling market while still losing value. We therefore check both its relative performance and its own price trend.
What Is a Relative Rotation Graph?
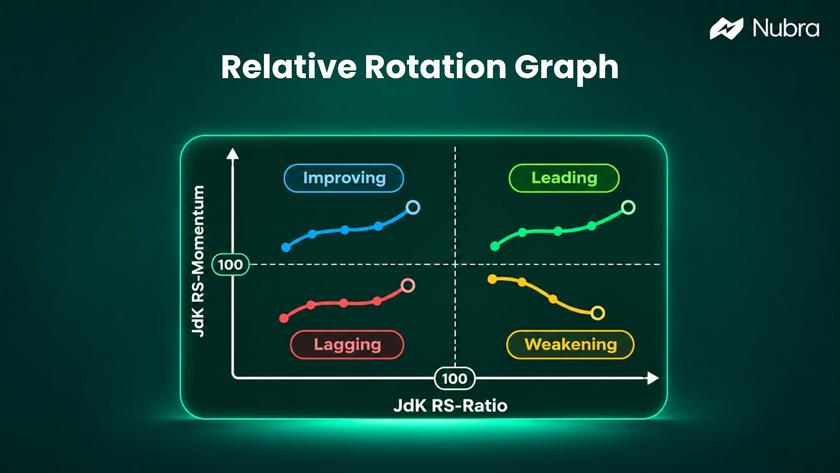
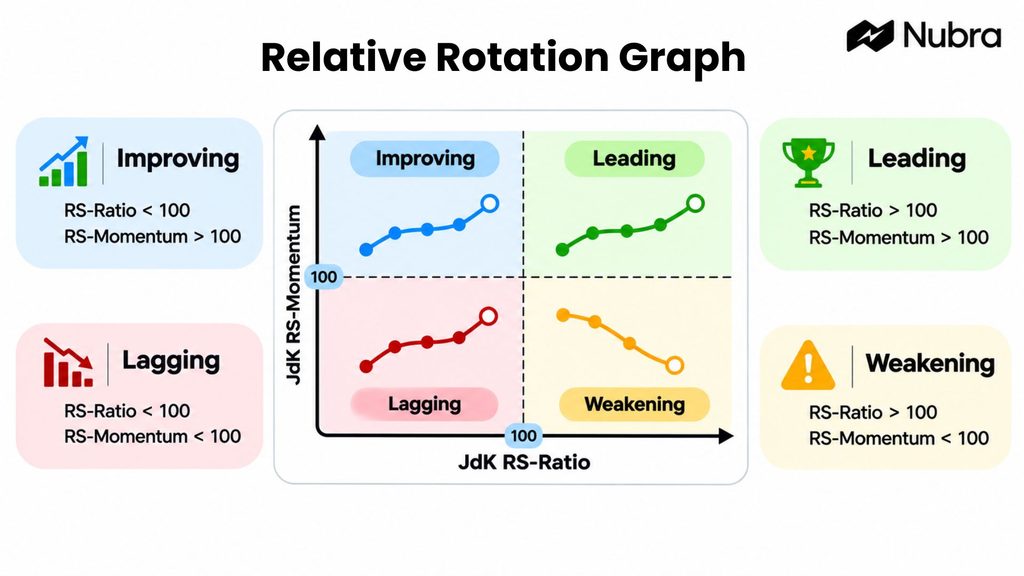
A relative rotation graph is a chart that plots multiple instruments using two indicators: JdK RS-Ratio and JdK RS-Momentum. Developed by Julius de Kempenaer, the format divides relative performance into four quadrants: Leading, Weakening, Lagging and Improving.
We choose a group to study and a benchmark against which to compare it. For example, we might compare Indian sector indices with the Nifty 50. Each sector appears as a point, with a trailing line showing its earlier positions.
We use this view of market leadership to narrow our research, rather than predict which sector must rise next.
How the Two RRG Axes Work
The horizontal and vertical axes cross at 100. Both indicators are normalised around that reference level so we can compare instruments on a common scale.
JdK RS-Ratio: The Relative Trend
JdK RS-Ratio appears on the horizontal axis. It measures the trend in an instrument’s performance relative to the benchmark.
Above 100, we see an uptrend in relative performance; below 100, a downtrend. These are not percentage returns: an RS-Ratio of 104 does not mean a 4% gain or 4% outperformance.
We also need to distinguish this indicator from a simple price ratio. Dividing a sector index by a benchmark gives us a starting point for relative-strength analysis, but that calculation alone does not reproduce the proprietary JdK indicators.
JdK RS-Momentum: The Momentum of the Relative Trend
JdK RS-Momentum appears on the vertical axis. It measures the momentum of RS-Ratio, helping us assess whether the relative trend is gaining or losing strength.
A reading above 100 indicates positive relative momentum; below 100 indicates negative relative momentum. Momentum can change before the relative trend changes. That is why we can see a sector with an established relative uptrend move down the chart as its momentum fades.
Neither axis measures a stock’s rupee price. We return to the price chart to assess that separately.
Understanding the Four RRG Quadrants
The four quadrants combine the two readings. We can read each position as follows:
Leading: Upper Right
Both RS-Ratio and RS-Momentum are above 100. The relative trend is positive and supported by positive relative momentum.
We may examine this sector more closely, but Leading is not an instruction to buy. Price could be near resistance, or an upcoming event could change conditions.
Weakening: Lower Right
RS-Ratio remains above 100, while RS-Momentum is below 100. The relative uptrend is still present, but its momentum has weakened.
We check whether the slowdown persists. Weakening does not automatically mean a falling price; the sector may still be rising.
Lagging: Lower Left
Both readings are below 100. The relative trend is negative, with negative relative momentum.
We do not assume that relative weakness makes the sector cheap or ready to recover. It can remain weak for an extended period.
Improving: Upper Left
RS-Ratio is below 100, but RS-Momentum is above 100. The relative trend is still negative, while momentum has improved.
We watch whether the improvement develops into a relative uptrend. The recovery may fade before the sector reaches Leading.
For a numerical illustration, suppose a sector has an RS-Ratio of 102 and RS-Momentum of 101. We place it in Leading because both readings are above 100. If momentum later falls to 99 while RS-Ratio remains at 102, the latest point moves into Weakening.
These hypothetical readings illustrate a change in relative momentum. They do not describe a current sector or provide a price target.
How We Read RRG Tails and Rotation
A tail joins an instrument’s earlier RRG positions to its latest point. Each observation represents the selected chart period. On a weekly setting, successive observations represent weeks; on a daily setting, they represent trading days.
We read the latest point together with the path behind it. A point in Leading that is moving down and left tells a different story from one moving up and right in the same quadrant.
With the same settings and number of observations, wider gaps between points show faster changes in RRG coordinates; tightly grouped points show smaller changes. We avoid comparing tails with different settings or treating a long tail as a guaranteed price trend.
The familiar rotation runs clockwise: Leading → Weakening → Lagging → Improving → Leading. It is a useful model, rather than a fixed timetable. An instrument may reverse direction, remain in one quadrant, or move between two quadrants without completing a full circuit.
Relative Strength Versus Absolute Returns: An Example
Suppose the Nifty 50 falls 8% over a chosen period, while a hypothetical sector index falls 3%. The sector has performed better than the benchmark by five percentage points, but it has still lost value.
We can see the same distinction with a hypothetical stock. If its price falls from ₹1,000 to ₹970, a holding of 100 shares falls in value from ₹1,00,000 to ₹97,000 before costs. Outperforming the benchmark has not prevented a ₹3,000 decline.
Those returns alone do not establish an RRG quadrant. The chart uses the calculated relative trend and its momentum across observations, rather than assigning a position from one return comparison.
Conversely, a stock rising 4% while its benchmark rises 10% has gained in price while underperforming.
How We Use an RRG for Indian Market Analysis
We can make our review more consistent by keeping the benchmark, timeframe and follow-up checks explicit.
1. Choose a Relevant Benchmark
For a broad sector comparison, we might use the Nifty 50. If we are comparing banks within the banking sector, a banking index may answer a different, more specific question.
The benchmark changes the meaning of relative strength. A bank could outperform its sector while that sector underperforms the broader market. We record the benchmark alongside our observations so we do not mistake one comparison for the other.
2. Keep the Timeframe Consistent
We choose daily or weekly observations according to the horizon we are studying. A weekly chart can provide broader context, while a daily chart shows changes at a shorter interval. Neither setting is universally right.
We compare like with like and note when we change settings. An Improving reading on a daily chart can coexist with a weaker weekly picture. Our guide to time series analysis explains why the order and interval of market observations matter.
3. Examine the Sector’s Constituents
After identifying a sector for further research, we look at the stocks within it. A sector index summarises a group; it does not tell us that every constituent shares the same trend.
A few heavily weighted stocks may account for much of the move, so we check individual charts before drawing stock-level conclusions.
4. Return to Price, Participation and Risk
We review the actual price trend, nearby support and resistance, trading activity and relevant events. If the RRG picture improves while price remains below a level we are watching, we record that disagreement rather than ignoring it.
For options research, the underlying instrument’s relative strength is only one input. We also need to examine the contract, expiry and premium behaviour. Our explanation of OI spurts shows why an increase in open interest needs context rather than a simple bullish or bearish label.
We can record what would weaken our interpretation before reviewing the chart again. That makes it easier to assess new evidence without rewriting our reasoning after every move.
What an RRG Helps Us See – and What It Leaves Out
An RRG gives us a compact way to compare several relative trends. Instead of moving between many separate ratio charts, we can review the group together and choose where to investigate further.
The chart reflects historical price relationships and may react after conditions change. It does not explain why leadership is shifting, establish a company’s value, or assess an options contract’s liquidity.
Our choice of universe also matters. A chart containing only a few strong sectors leaves out the weaker parts of the market. We should know what is included before drawing a broad conclusion.
Changes in interest-rate expectations, earnings or other news may interrupt a rotation. We cannot infer future gains, a stop-loss level or an appropriate position size from a quadrant alone.
RRG Versus RSI: What Is the Difference?
RRG and the Relative Strength Index sound similar, but they answer different questions.
With an RRG, we compare instruments against a benchmark using relative trend and relative momentum. With RSI, we study one instrument’s recent upward and downward price movements on a scale from 0 to 100.
An RSI reading does not tell us whether a stock is outperforming the Nifty 50. Likewise, an RRG position does not tell us whether that stock’s RSI is high or low.
We can use both perspectives without treating either as a complete signal. Our guide to the Relative Strength Index explains its calculation, interpretation and limitations.
Taking Our Research Further With Nubra
We can use Nubra Charts, available through the Terminal, to review price behaviour and relevant levels. For options analysis, Nubra Option Chain helps us examine strike-level information, including open interest and Greeks. With Nubra Strategy Builder, we can explore options payoff scenarios.
These tools support our analysis; they do not confirm that an RRG rotation will continue or guarantee realised results. Some views require us to sign in.
FAQs
Does the Leading Quadrant Mean a Sector Is Bullish?
It indicates a positive relative trend with positive relative momentum. We still need to check the sector’s own price. Relative leadership can occur during a decline if the benchmark is weaker.
Is an RRG the Same as RSI?
No. We use an RRG to compare instruments against a benchmark. RSI measures one instrument’s recent price momentum. The shared phrase “relative strength” does not make them interchangeable.
What Does 100 Mean on an RRG?
It is the reference level around which the two JdK indicators are normalised. We use it to distinguish positive and negative relative trend or momentum readings. It is not a price, percentage return or RSI threshold.
Should We Use a Daily or Weekly RRG?
We choose the setting according to our research horizon. Weekly observations give broader context; daily observations show shorter-interval changes. We keep the settings consistent when comparing instruments or reviewing changes over time.
Can We Use an RRG as a Buy or Sell Signal?
An RRG does not provide a complete trading rule. We need additional analysis, risk limits and a clearly defined process. A move between quadrants can reverse and does not guarantee a profitable trade.
Can We Create an RRG With Nubra’s Tools?
The Nubra tools discussed here support price-chart review, option-chain analysis and options payoff scenarios. We should check current product information for RRG availability; this guide does not establish that Nubra provides a native RRG chart.
Disclaimer: The information provided in this blog is for educational and informational purposes only and should not be construed as investment advice, financial advice, or a recommendation to buy, sell, or hold any securities or financial products. Investments in the securities market are subject to market risks. Please read all related documents carefully before investing. Readers should conduct their own research and consult a SEBI-registered investment adviser or other qualified financial professional before making any investment decisions. Past performance is not indicative of future results.