The XHMaster Formula indicator is a custom technical analysis tool that displays potential bullish and bearish conditions through coloured signals. It is also called Xmaster Formula, although similarly named versions may work differently. Its appeal is straightforward: we can see a simplified signal instead of interpreting several indicator panels at once. The harder question is…
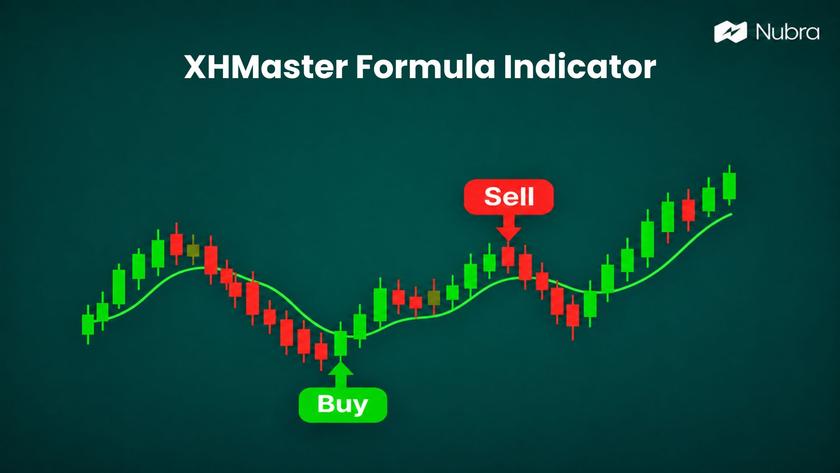
The XHMaster Formula indicator is a custom technical analysis tool that displays potential bullish and bearish conditions through coloured signals. It is also called Xmaster Formula, although similarly named versions may work differently.
Its appeal is straightforward: we can see a simplified signal instead of interpreting several indicator panels at once. The harder question is whether that signal adds useful information after we account for delays, false signals and trading costs.
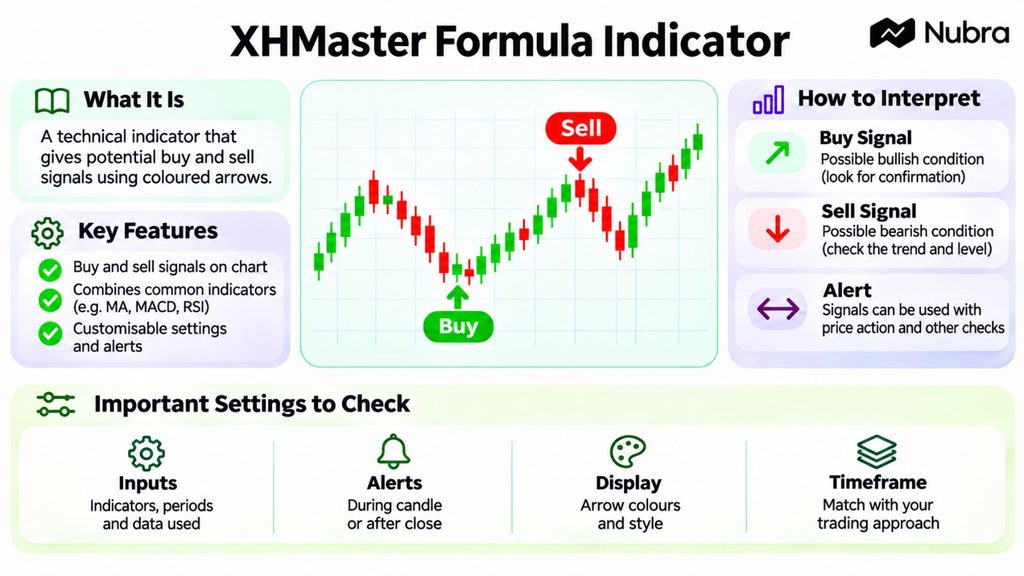
What is the XHMaster Formula Indicator?
XHMaster is a third-party indicator rather than a standard indicator with one universally defined calculation. Different publishers distribute tools under Xmaster or XHMaster names, so the name alone does not establish the calculation, settings or supported platform.
For example, TradingFinder describes its MT4 version as combining moving averages and MACD, with green and red arrows. That description applies to its version; we should not assume every similarly named download uses identical rules.
The useful distinction is between an indicator and a trading system. An indicator presents an interpretation of market data. A complete system also needs entry conditions, exit rules, position sizing and limits on losses. An arrow does not supply all those decisions.
How Does XHMaster Work?
We need the calculation rules for the exact version. A list of ingredients, such as moving averages, RSI or MACD, does not reveal its thresholds or signal timing.
When checking documentation, we separate three questions:
- Inputs: Which prices, indicators or other data does this version use?
- Decision rule: What must happen before it displays a signal?
- Timing: Is the signal calculated during the candle or after it closes?
Our guides to MACD and the Relative Strength Index explain these indicators in more detail.
How Do We Read Buy and Sell Signals?
In versions that use green upward arrows and red downward arrows, a green arrow usually represents a bullish condition and a red arrow a bearish condition. We still need to check the version’s legend because colours and display styles may be configurable.
We read the signal alongside the price chart:
- Has price been making higher highs and higher lows, or the reverse?
- Is the signal appearing close to a level where price previously reversed?
- Has the candle closed, or can the current reading still change?
- Has most of the move already happened before the signal appeared?
Imagine a bullish arrow appearing just below a price level that has repeatedly resisted advances. The arrow and the resistance are different pieces of information. Ignoring the resistance because the arrow is green would leave our analysis incomplete.
We also distinguish a bearish reading from an instruction to sell a particular instrument. Selling shares, buying a put and writing a call create different exposures and risks. One coloured signal cannot choose between them.
What Settings Should We Check?
There are no universal XHMaster default settings that we can responsibly recommend. The options available depend on the file. Some versions expose mainly display and alert controls; others may provide calculation inputs.
We begin by saving the original settings and recording what each editable field does.
- Display settings: Confirm what each colour, line or arrow means.
- Alert settings: Establish whether notifications arrive during a candle or after confirmation.
- Calculation inputs: Read the documentation before changing any period, filter or sensitivity value.
- Data dependencies: Check whether the script uses another timeframe or requires another indicator.
We check the publisher’s explanation of “sensitivity”; the label may mean different things across scripts.
Changing several inputs after every losing signal makes comparison difficult. A more useful experiment changes one documented variable, keeps the others fixed, and records the result across a consistent sample.
Which Timeframe Should We Use?
The timeframe should match the question we are studying. A five-minute chart describes shorter price movements than an hourly chart; neither becomes suitable simply because a download page calls it the best setting.
We can compare a signal timeframe with a broader chart to understand context. For example, an intraday bullish signal may sit within a wider downward price structure. That disagreement deserves attention rather than an automatic assumption that one chart is correct.
For a fair comparison, we keep the instrument, session, signal rules and costs consistent. Otherwise, a change in results may come from different market conditions rather than the timeframe itself.
How Do We Install and Check XHMaster?
Installation depends on the platform and the exact file. An MT4 build is not interchangeable with an MT5 build, and a TradingView script is a separate implementation that needs its own review.
For a documented MetaTrader desktop version, the usual sequence is:
1. Confirm the publisher, platform and file type before downloading.
2. Open the terminal’s data folder and locate its indicator directory.
3. Follow the publisher’s installation instructions for that platform.
4. Refresh the indicator list or restart the terminal if required.
5. Attach the indicator to a demonstration chart and inspect its inputs.
6. Check the displayed signals and alerts before evaluating any trading rules.
We should treat requests for extra permissions separately from installation. MetaTrader provides controls for external libraries and website requests; these are not settings to enable automatically for an unfamiliar download.
If the indicator does not load, we check compatibility, the installation path and error messages before considering additional permissions.
We also verify desktop, mobile and browser support independently. A desktop installation guide does not prove that custom scripts can run in a mobile app.
Does the XHMaster Formula Indicator Repaint?
We cannot give a blanket non-repainting assurance for every XHMaster version. The meaningful check concerns the exact script and how its historical output compares with what appeared in real time.
Repainting can include differences between historical and real-time calculations. A signal that changes while its candle is forming is also different from a signal that is added to an earlier candle after later information becomes available.
A practical observation exercise is to record several signals as they appear, note the candle time, and compare them after the candle closes and the chart reloads. If the script uses a higher timeframe, we also need to understand when that timeframe’s data becomes confirmed.
This exercise can reveal changes, but a short observation period cannot prove that a script never repaints. Documentation and code review, where available, provide additional context.
We should also separate repainting from delay. A signal may remain fixed after confirmation yet arrive late in a move. Stable historical arrows do not establish that an entry would have been timely or profitable.
How Can We Evaluate an XHMaster Setup?
We start with a written hypothesis. For example, does requiring a break of a nearby price level after a confirmed signal change the results? This is a testable question, not a trading recommendation.
Our evaluation needs explicit rules for:
- The instrument, timeframe and session being studied.
- What makes a signal eligible for inclusion.
- When an entry could realistically occur.
- What invalidates the setup and how an exit is measured.
- The position size, costs and treatment of gaps.
We record skipped signals too. Without them, it is easy to remember attractive examples and overlook occasions when the same reasoning would have failed.
Adding another indicator also needs a reason. Two indicators derived from similar price inputs may agree because they describe the same movement. Agreement alone does not establish two independent confirmations.
A Hypothetical Example of Risk and Reward
Suppose we are evaluating a fictional cash-equity setup with an entry at ₹500, an invalidation level at ₹492 and an exit objective at ₹516. These figures illustrate arithmetic only; they are not a security recommendation.
The planned price risk is ₹8 per share, while the distance to the objective is ₹16 per share. That produces a planned reward-to-risk ratio of 2:1 before charges and execution differences.
For 100 shares, the corresponding amounts are ₹800 of planned price risk and ₹1,600 of potential gross gain at the objective. A stop order does not guarantee an exit at ₹492, so the actual loss could be larger.
Now suppose the indicator appears late and the hypothetical entry becomes ₹508, with the same invalidation and objective. The planned price risk becomes ₹16 per share, while the remaining upside becomes ₹8. The ratio falls to 0.5:1.
The signal direction has not changed, but the economics have. This is why we assess the available entry price rather than treating every arrow as equivalent.
How Do We Backtest it Without Misleading Ourselves?
Our backtest must use information available at the time and include every qualifying signal.
First, we separate the data used to develop rules from later data used to evaluate them. Repeatedly changing settings until one historical period looks attractive can produce a rule that fits that period without generalising.
Next, we include realistic transaction costs and execution assumptions. A strategy that depends on buying at a candle’s low after a closing signal would be using a price that was no longer available.
We then compare several measures:
- Number of eligible signals and completed hypothetical trades.
- Average gain and average loss after modelled costs.
- Total net result and the size of losing periods.
- Results across different market conditions.
- Differences between historical testing and forward observation.
One useful calculation is expected result per trade: the win rate multiplied by the average win, minus the loss rate multiplied by the average loss, minus average costs. We keep the units consistent and avoid subtracting costs twice if the gains and losses are already net.
Finally, we preserve the original rules during a forward observation period. If the method changes, we start a clearly labelled new test rather than merging incompatible results.
We keep a journal of signal times, settings, available entry prices, exit conditions and outcomes. It should distinguish live observations from reconstructed examples and record practical problems such as late alerts or missing data. Any exclusions, including scheduled-event windows, need to be defined before the test.
How Accurate are XHMaster Signals?
There is no single accuracy percentage that describes all versions, instruments and trading rules. Even a genuine result is incomplete without the sample, timeframe, costs and definition of a successful signal.
Consider a hypothetical method with seven gains of ₹100 and three losses of ₹300. Its win rate is 70%, but the total is a ₹200 loss before costs. A high percentage of winning trades therefore does not establish profitability.
We look for repeatable rules, losing examples and results beyond the period used to choose settings. Historical percentages do not establish the next trade’s outcome.
What are its Benefits and Limitations?
The potential benefit is a simpler visual display. If the signal rules are documented, we can use that display to organise observations and maintain a consistent review process.
The limitations remain substantial. We may have limited visibility into the calculation, version names can cause confusion, and an indicator can produce false or delayed signals. A simpler display can also encourage us to overlook the price structure behind it.
What Changes When We Analyse Indian Options?
A directional signal on an index is only one part of an options assessment. An option premium also responds to factors such as time remaining, implied volatility and the contract’s sensitivity to the underlying.
This means a bullish index move does not guarantee a gain in every call option. We need to consider the chosen strike, expiry, premium and the timing of the move, as well as liquidity and execution.
Our option-chain guide explains the information available across contracts. For the volatility side, our guide to implied volatility in options explains why a directional view is not a complete premium forecast.
We should not carry a result from an overseas currency chart straight into Nifty options. The instrument, contract structure and trading conditions need a separate evaluation.
Where Do Nubra’s Tools Fit into the Analysis?
With Nubra Charts, we can review the underlying price chart. Nubra Option Chain provides a separate view of options information, including open interest, volume, implied volatility and Greeks. Nubra Strategy Builder is the relevant tool to explore when planning an options structure; our strategy-builder guide explains the concept.
Charts and Strategy Builder may require sign-in. XHMaster support on Nubra has not been verified; these tools support separate analysis and planning, without guaranteeing outcomes.
FAQs
Is XHMaster an Official MetaTrader Indicator?
XHMaster is a third-party custom indicator. Its name does not establish endorsement by MetaTrader or another charting platform. We need to check the publisher and exact version separately.
Is there one XHMaster Formula?
There is no universally verified formula across all similarly named versions. We need documentation for the specific script rather than a generic list of indicators it might contain.
Does XHMaster Repaint After a Candle Closes?
That depends on the implementation. We should compare recorded real-time signals with the reloaded chart and check how the script handles unconfirmed data. A publisher’s claim alone is not independent verification.
What are the Best XHMaster Settings for Intraday Trading?
There is no universal setting we can recommend. We first need to understand the available inputs, then test a consistent rule on the relevant instrument and timeframe with realistic costs.
Can a High XHMaster Win Rate Still Produce Losses?
Yes. If the average loss is sufficiently larger than the average gain, the method can lose money despite winning frequently. Charges and execution differences can reduce results further.
Can We Use XHMaster Directly on Nubra?
We have not verified XHMaster support on Nubra. Nubra Charts, Option Chain and Strategy Builder can serve separate analysis and planning purposes; their availability does not establish custom-script compatibility.
Disclaimer: The information provided in this blog is for educational and informational purposes only and should not be construed as investment advice, financial advice, or a recommendation to buy, sell, or hold any securities or financial products. Investments in the securities market are subject to market risks. Please read all related documents carefully before investing. Readers should conduct their own research and consult a SEBI-registered investment adviser or other qualified financial professional before making any investment decisions. Past performance is not indicative of future results.