Time series analysis is the study of data points arranged in time order. In trading, this usually means looking at market data such as price, returns, volume, volatility, open interest, implied volatility, or indicator values across minutes, days, weeks, or months. The goal is simple: we study how a variable has behaved over time so…
Time series analysis is the study of data points arranged in time order. In trading, this usually means looking at market data such as price, returns, volume, volatility, open interest, implied volatility, or indicator values across minutes, days, weeks, or months.
The goal is simple: we study how a variable has behaved over time so we can understand patterns, changes, and risks more clearly. That does not mean the future becomes certain. Markets react to news, liquidity, positioning, macro events, and trader behaviour. Time series analysis helps organise the evidence, but it should never be treated as a guarantee.
For traders, the concept matters because almost every chart is a time series. A Nifty 50 five-minute chart, a Bank Nifty option premium chart, a daily open interest series, and a volatility index chart all show observations recorded across time. Once we understand how to read these sequences, we can move beyond isolated price points and study behaviour: trend, momentum, volatility, mean reversion, cycles, breakouts, and sudden regime changes.
What Is Time Series Analysis?
Time series analysis is a statistical method used to examine data collected at regular or meaningful time intervals. The data is ordered chronologically, so the sequence itself matters.
A single closing price may tell us where a stock ended the day. A time series of closing prices tells us how that stock moved over many sessions. That extra context helps us ask better questions:
- Is the market trending or moving sideways?
- Has volatility increased compared with the recent past?
- Are returns showing persistence or random movement?
- Is volume rising with price, or is the move weak?
- Is open interest building into expiry?
- Are option premiums reacting more to price movement or volatility?
In trading, time series analysis is not limited to forecasting. It can be used for exploration, monitoring, signal testing, risk review, and strategy validation. A trader may use it to study whether a moving average crossover showed useful historical behaviour on a stock, whether volatility tends to expand before certain events, or whether option-chain data shows repeated behaviour near expiry.
What Makes Market Data A Time Series?
Market data becomes a time series when each observation is connected to a timestamp. The interval depends on the workflow.
| Data type | Example frequency | Trading use |
|---|---|---|
| Price | Tick, 1-minute, daily | Trend, momentum, support and resistance |
| Returns | Daily, weekly, monthly | Return and risk analysis |
| Volume | Intraday or daily | Participation and liquidity context |
| Open interest | Daily or intraday | F&O positioning and expiry behaviour |
| Implied volatility | Intraday or daily | Option premium and volatility analysis |
| Indicators | Any chart interval | Signal testing and confirmation |
The chosen frequency changes the interpretation. A one-minute chart may help a scalper study short-term order flow, while a daily chart may help a swing trader understand broader direction. Before analysing a series, define the question, the frequency, the data range, and the reason that frequency fits the trade or research problem.
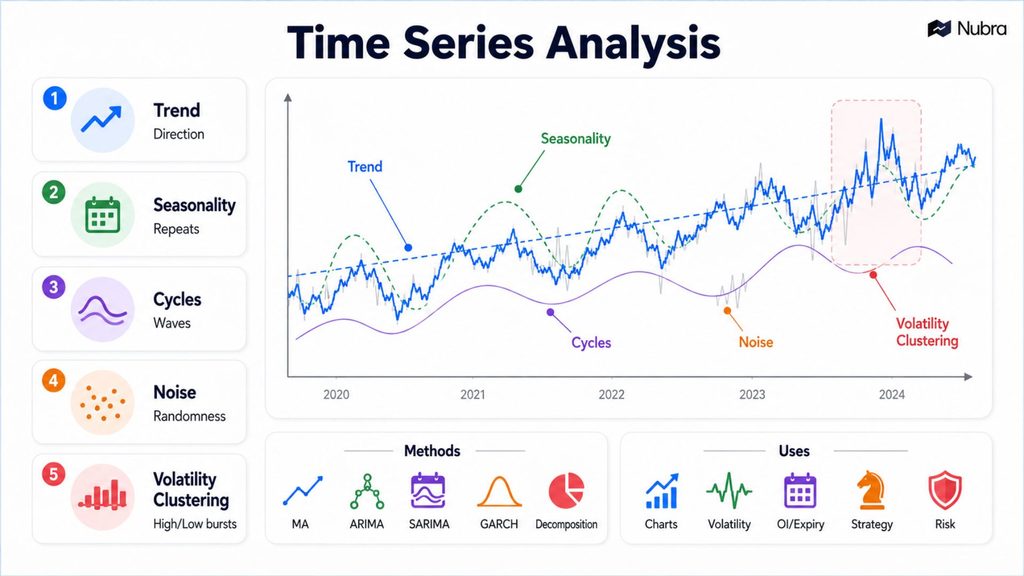
Key Components Of A Time Series
Most time series can be studied through a few recurring components. Financial markets do not always behave cleanly, but these concepts provide a useful starting point.
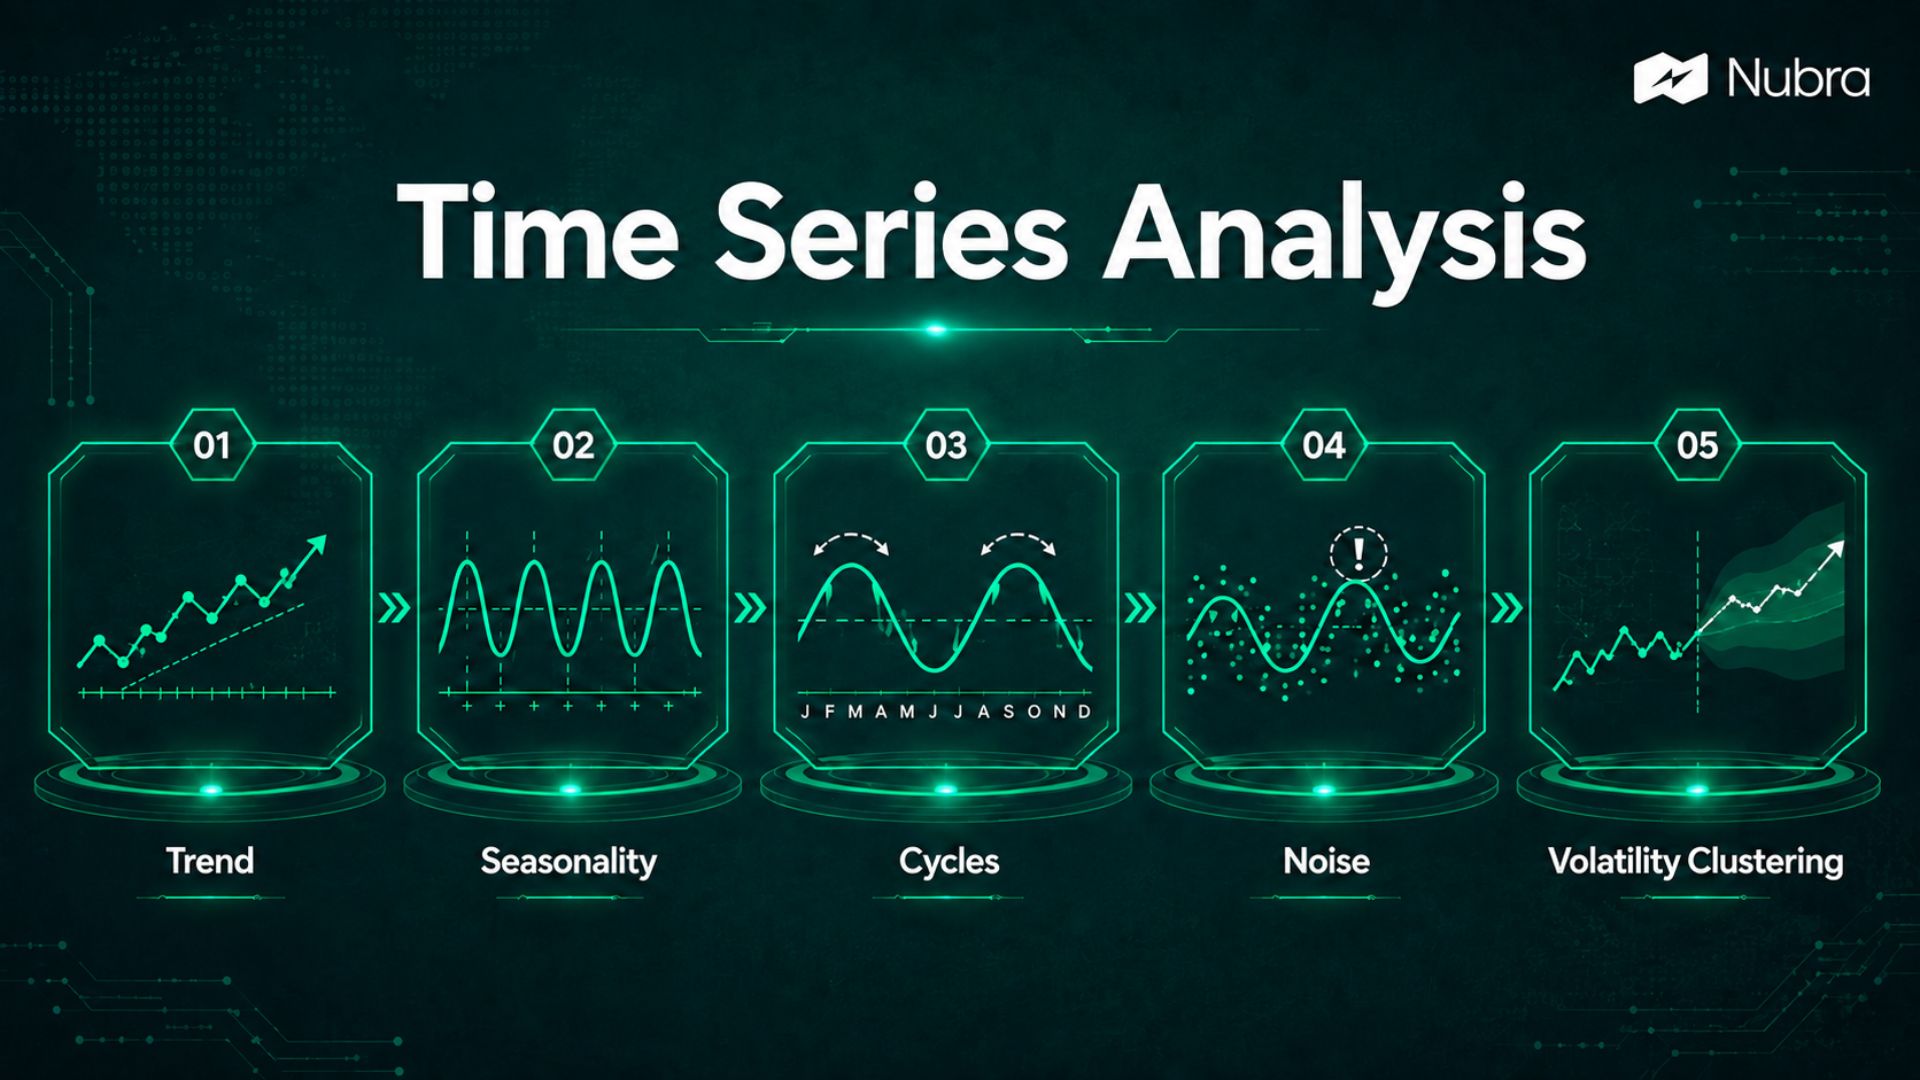
Trend
Trend refers to the broad direction of the series. Prices may rise, fall, or move sideways over a period. Traders often study trend with moving averages, higher highs and higher lows, trendlines, or regression-based tools.
If Nifty keeps closing above a rising 50-day moving average, we may describe the broader series as upward trending. That observation does not mean every intraday trade should be long. It simply gives context for the selected period.
Seasonality
Seasonality means a pattern that repeats at regular intervals. In business data, this may appear around festivals, quarters, or weather cycles. In markets, seasonal behaviour can appear around expiry, earnings periods, budget announcements, or recurring liquidity patterns.
Indian F&O traders often pay attention to weekly and monthly expiry behaviour. Option premiums, open interest, and volatility can behave differently near expiry. Time series analysis helps us study whether that behaviour is visible in the data instead of relying only on memory.
Cycles
Cyclicality refers to longer waves that repeat, but not always at fixed intervals. Markets may move through accumulation, breakout, distribution, and correction phases. Macro cycles, interest-rate expectations, sector rotation, and liquidity conditions can influence these patterns.
Cycles are useful to study, but they are easy to overfit. If we force a cycle onto every chart, we may start seeing structure where none exists.
Noise
Noise is random movement that can hide the underlying signal. Intraday charts often contain a lot of noise because every small order, news headline, spread change, and liquidity pocket can move price.
This is why the same strategy may look sensible on one timeframe and unreliable on another. Time series analysis does not remove noise completely, but it helps us measure and filter it more carefully.
Volatility Clustering
Markets often show volatility clustering: high-volatility periods tend to be followed by high-volatility periods, and quiet periods can remain quiet for some time. This is especially relevant in options because option premiums are sensitive to volatility expectations.
When studying a Bank Nifty option strategy, we should not only ask where the index moved. We should also ask how volatility behaved and whether the strategy was exposed to sudden movement near expiry.
How Time Series Analysis Works
A practical time series workflow starts with the question. We should know whether we are trying to understand trend, forecast a variable, compare volatility, test a signal, or monitor a strategy.
1. Collect The Right Data
The series should match the trading problem. If we are studying intraday scalping, end-of-day data may be too coarse. If we are studying a positional strategy, tick data may add noise without improving the conclusion. Missing candles, wrong timestamps, corporate actions, illiquid contracts, and expired option series can also distort analysis.
2. Visualize The Series
Charts help us see broad behaviour before applying models. A simple line chart, candlestick chart, volatility chart, or open interest chart can reveal gaps, outliers, structural breaks, and trend shifts. Many mistakes happen when a model is applied before the data is understood.
3. Check Stationarity
Stationarity means the statistical properties of a series, such as mean and variance, remain relatively stable over time. Many classical models work better when the series is stationary.
Raw stock prices are often not stationary because they can trend. Returns are usually more useful for statistical analysis because they tend to have a more stable average and spread over time than raw prices.
4. Identify Dependence
Time series analysis studies whether past values have any relationship with future values. Autocorrelation is one way to test whether a series is correlated with its own past. In trading, this can support questions such as:
- Do strong returns tend to continue for a few periods?
- Does a sharp fall tend to be followed by a bounce?
- Does volatility today say anything about volatility tomorrow?
- Does open interest build-up continue into expiry?
These relationships can change when liquidity, volatility, or participation changes.
5. Build And Test A Model
Models can range from simple moving averages to advanced statistical and machine-learning methods. The useful model is the one that fits the question, handles the data honestly, and is tested on periods it has not already seen. If we keep changing parameters until a model looks excellent on historical data, the result may fail in live markets.
Common Time Series Methods Used In Markets
Time series analysis includes many methods. Traders do not need to use all of them, but understanding the main families helps in choosing the right tool.
| Method | What it studies | Trading relevance |
|---|---|---|
| Moving averages | Smoothed price direction | Trend context and signal filters |
| Autocorrelation | Relationship with past values | Momentum or mean-reversion research |
| AR, MA, ARMA | Linear dependence in a series | Basic statistical modelling |
| ARIMA | Non-stationary series after differencing | Forecasting and structured analysis |
| SARIMA | Seasonal patterns | Repeating behaviour by period |
| ARCH/GARCH | Changing volatility | Options, risk, and volatility analysis |
| Decomposition | Trend, seasonality, residuals | Understanding components separately |
| Machine-learning models | Nonlinear patterns | Research workflows, with high overfitting risk |
The method should follow the market question. If the focus is option premium behaviour, volatility models may matter more than a simple price forecast. If the focus is intraday momentum, autocorrelation and moving averages may be more practical.
Time Series Analysis Vs Technical Analysis
Technical analysis and time series analysis overlap, but they are not identical.
Technical analysis often uses chart patterns, indicators, support and resistance, moving averages, RSI, MACD, Bollinger Bands, and price-volume behaviour. Time series analysis is broader and more statistical. It asks how observations behave over time, whether the series has trend or stationarity, and whether past values matter.
In practice, a trader may use both. A moving average crossover can be treated as a technical signal. Time series analysis can then test whether that signal had useful behaviour historically, how often it failed, and whether the signal survived different volatility regimes.
How Traders Use Time Series Analysis
Time series analysis can support several trading workflows.
Trend And Momentum Review
A trader may study whether an index, sector, or stock has shown persistent direction. This can include moving averages, rolling returns, trend strength, or breakout follow-through. The practical mistake to avoid is assuming every trend will continue.
Volatility And Options Planning
Options traders care about volatility because premiums can change even when the underlying price does not move much. A time series of implied volatility, historical volatility, or option premium can help us study whether the market is pricing more uncertainty than usual. This is useful for planning, but it is not a shortcut to a guaranteed strategy.
Open Interest And Expiry Behaviour
Open interest is especially relevant in F&O markets. A time series of OI can show how positions build or unwind across strikes and expiries. Combined with price and volume, it may help traders understand participation. Large OI at a strike does not make that level unbreakable.
Strategy Testing
Before using a rule-based strategy, traders often test it across historical data. Time series analysis supports this by organising entries, exits, returns, drawdowns, win rate, average loss, and risk-adjusted behaviour over time. Good testing includes costs, slippage, liquidity assumptions, and market-regime checks.
Risk Monitoring
Rolling volatility, drawdown, correlation, and exposure are all time-based measures. A trader can use them to identify when a strategy is behaving differently from its historical pattern. This is often more useful than prediction.
Limitations Of Time Series Analysis
Time series analysis is powerful, but it has clear limits.
Markets are not controlled laboratory systems. A model trained on past data can miss new events, policy changes, liquidity shocks, earnings surprises, global cues, or sudden sentiment shifts. Historical patterns can break.
Data can also mislead. Short samples may exaggerate a pattern. Old data may describe a market that no longer behaves the same way. Illiquid contracts may create false signals. Indicator-heavy systems can overfit when too many parameters are tuned.
The practical guardrail is to treat time series analysis as decision support. It can help us ask better questions, compare scenarios, and understand risk. It should not be treated as investment advice or a promise of returns.
Where Nubra Fits In The Workflow
Nubra Charts can provide price context for a time-series review, and Nubra Option Chain provides strike-level data such as open interest, implied volatility and Greeks. Nubra Strategy Builder lets traders compare options payoff scenarios. Use these tools to support market review while separately checking the data, assumptions and out-of-sample results of any statistical model.
A trader studying Nifty or Bank Nifty may use charts to review trend and volatility, option-chain data to observe OI and IV behaviour, and strategy tools to think through payoff scenarios before acting. The value is not that a platform can predict the market. The value is that the trader can structure analysis and avoid making decisions from one isolated data point.
FAQs
What is time series analysis in simple words?
Time series analysis is the study of data recorded over time. In trading, it means analysing price, volume, returns, volatility, open interest, or other market data in chronological order to understand patterns and changes.
Why is time series analysis important for traders?
It helps traders study trend, volatility, momentum, mean reversion, option premium behaviour, and risk over time. It supports more structured analysis, but it does not guarantee profitable trades.
What are examples of time series data in trading?
Examples include daily stock prices, one-minute candles, option premiums, implied volatility, open interest, traded volume, rolling returns, moving averages, RSI values, and volatility index readings.
Is time series analysis the same as forecasting?
No. Forecasting is one use case, but time series analysis also includes exploration, monitoring, decomposition, signal testing, risk review, and model validation.
What is stationarity in time series analysis?
Stationarity means the statistical properties of a series, such as average and variance, remain relatively stable over time. Many statistical models work better on stationary data, which is why analysts often study returns instead of raw prices.
Which time series models are used in finance?
Common models include AR, MA, ARMA, ARIMA, SARIMA, ARCH, and GARCH. Traders may also use simpler tools such as moving averages, rolling volatility, autocorrelation, and decomposition depending on the problem.
Can time series analysis predict the stock market?
It can support forecasting and scenario analysis, but it cannot predict markets with certainty. Market outcomes depend on many changing factors, including news, liquidity, sentiment, macro events, and execution.
How can options traders use time series analysis?
Options traders can study option premium changes, implied volatility, historical volatility, open interest, expiry behaviour, and payoff scenarios across time. These insights can support planning, but they do not remove market risk.
Is time series analysis useful for intraday trading?
Yes, but intraday data can be noisy. Traders need to choose the right timeframe, account for costs and slippage, and avoid assuming that short-term patterns will continue in every market condition.
What is the biggest mistake in time series analysis?
The biggest mistake is overfitting: building a model that looks excellent on historical data but fails in live markets. A practical workflow should include clean data, realistic assumptions, out-of-sample testing, and clear risk limits.
Disclaimer: The information provided in this blog is for educational and informational purposes only and should not be construed as investment advice, financial advice, or a recommendation to buy, sell, or hold any securities or financial products. Investments in the securities market are subject to market risks. Please read all related documents carefully before investing. Readers should conduct their own research and consult a SEBI-registered investment adviser or other qualified financial professional before making any investment decisions. Past performance is not indicative of future results.