A double top pattern is a bearish reversal chart pattern that forms after an uptrend. It appears when price rises to a resistance area, pulls back, rises again toward a similar high, and then fails to continue higher. The pattern starts to matter only when price breaks below the support area between the two peaks,…
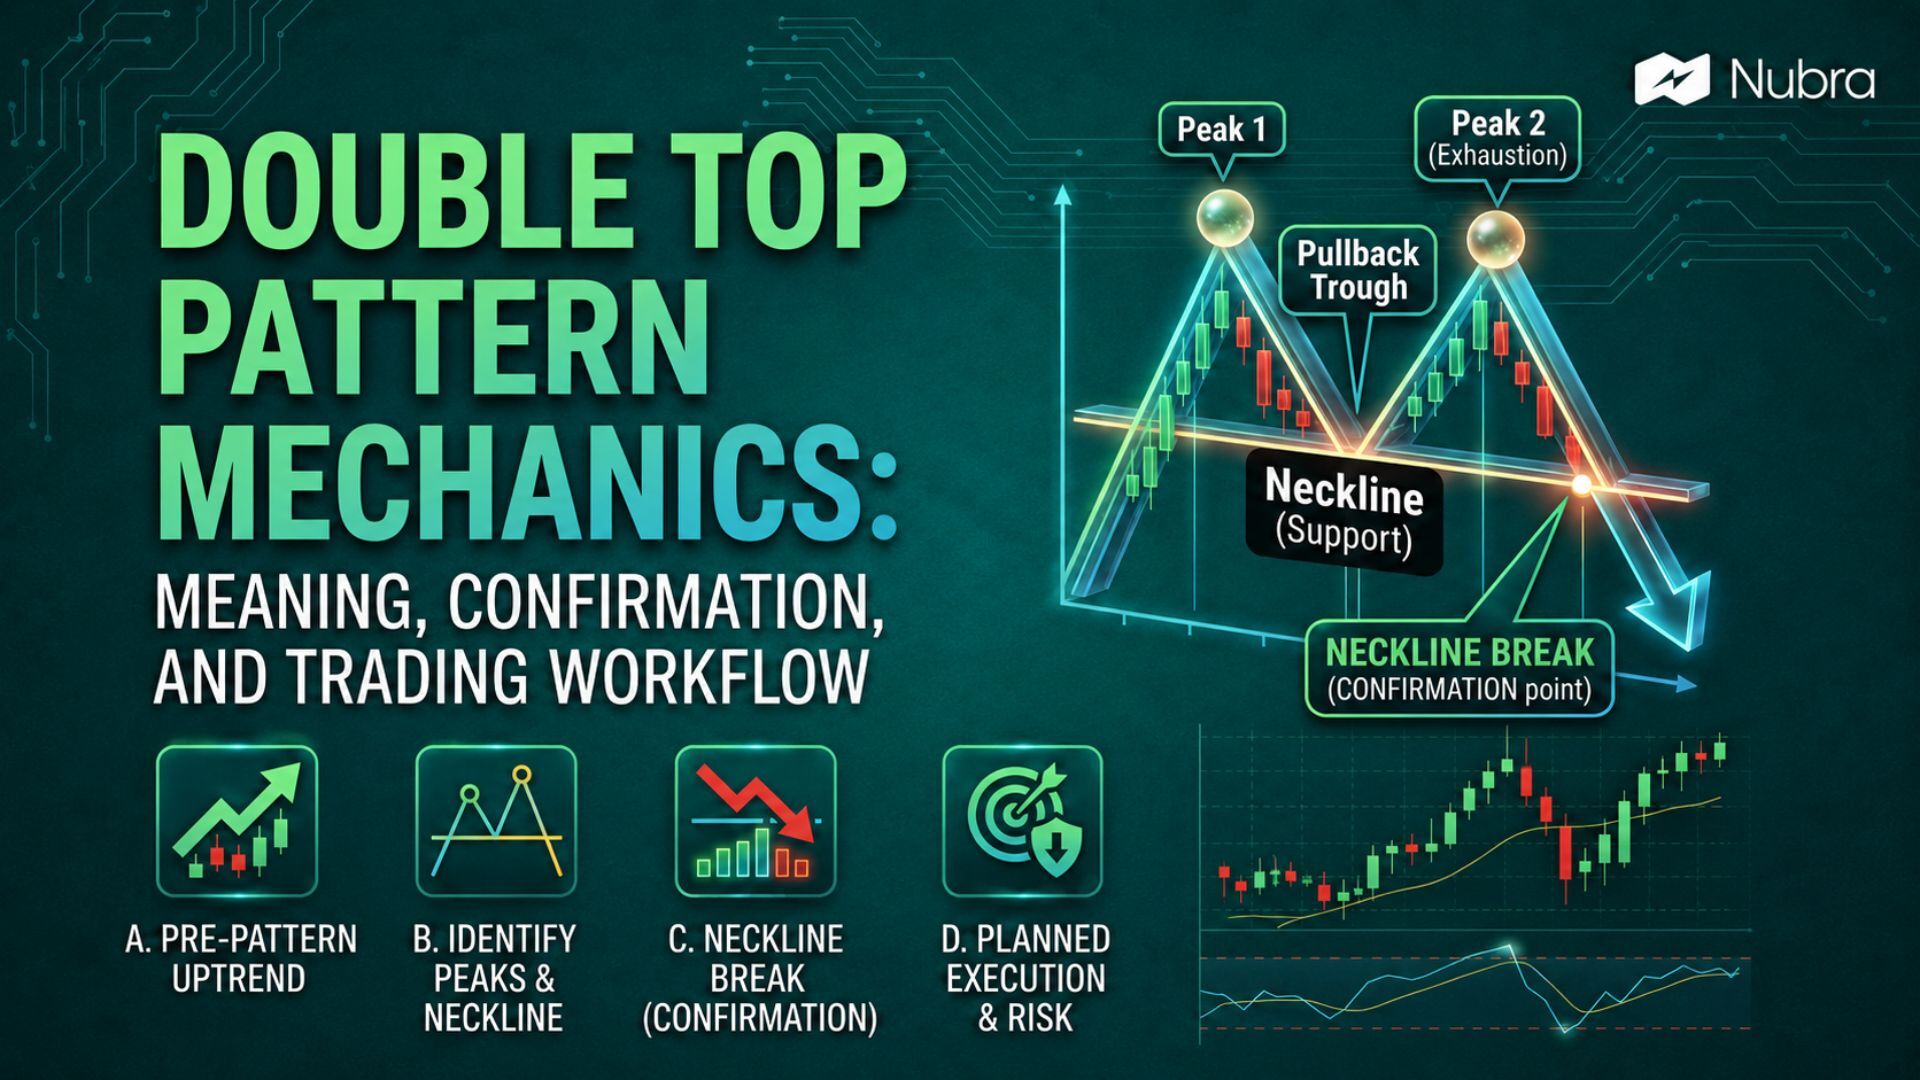
A double top pattern is a bearish reversal chart pattern that forms after an uptrend. It appears when price rises to a resistance area, pulls back, rises again toward a similar high, and then fails to continue higher. The pattern starts to matter only when price breaks below the support area between the two peaks, often called the neckline.
In practical trading, we should not treat every pair of similar highs as a double top. The pattern gives structure to a possible trend reversal, but it is not a prediction tool on its own. It needs context, confirmation, and risk control.
For Indian traders looking at stocks, indices, or F&O charts, the double top can help organise a bearish view after a strong rally. It can also help avoid chasing a move near resistance when price is already showing signs of exhaustion.
What Is a Double Top Pattern?
A double top pattern is a technical-analysis formation that suggests buyers may be losing control after an uptrend. It has two peaks near the same price level, with a decline between them. The low point of that decline becomes the neckline or support level.
The pattern usually looks like the letter M: price is already moving upward, reaches a high, pulls back, rallies again near the earlier high, and then falls below the neckline.
The neckline break is the key step. Before that break, the chart may only be showing consolidation near resistance. Once price closes below the neckline, traders may interpret the setup as a possible shift from bullish momentum to bearish pressure.
How a Double Top Forms
A double top begins with an existing uptrend. Buyers are in control, and price is making higher highs and higher lows. The first peak forms when price reaches a level where selling pressure starts to absorb demand. The pullback from that peak creates the trough between the two highs. If buyers step in again, price moves back toward the earlier peak and tests whether the market can break above resistance.
When price fails near the earlier high, the chart starts to show hesitation. Buyers tried twice, but the market could not push through the resistance area. If price then breaks below the neckline, the failed second rally becomes more meaningful because sellers have pushed price below the support created during the pattern.
This is why confirmation matters. A chart can show two similar highs and still continue upward. The pattern becomes stronger when the second peak is followed by a decisive neckline breakdown, preferably with stronger volume or supporting indicators.
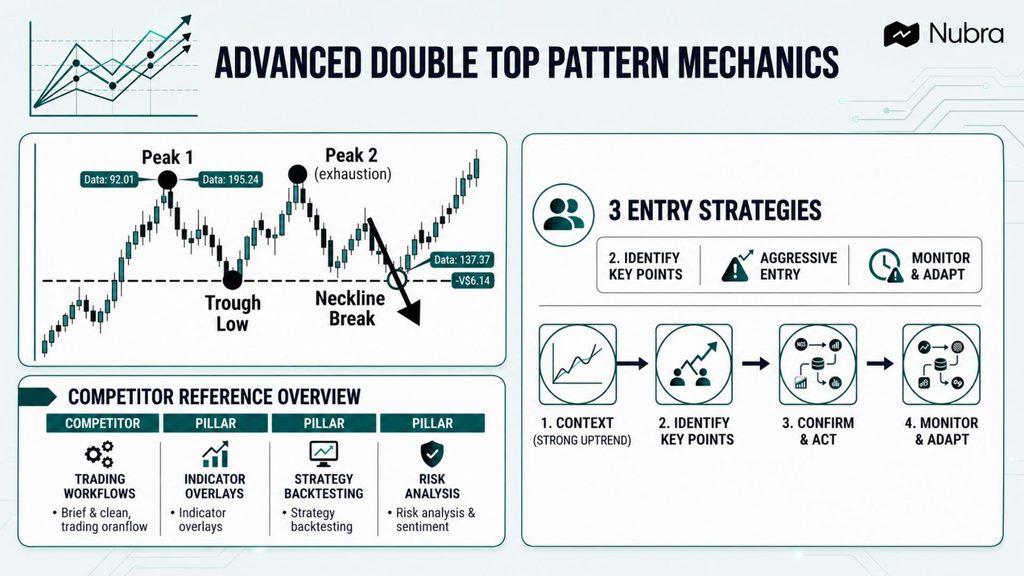
Main Parts of a Double Top Pattern
The first requirement is a clear uptrend before the pattern. Without an uptrend, there is no meaningful bullish move to reverse. A range-bound chart with two nearby highs may look similar, but it may not carry the same implication.
The first peak marks the point where the earlier rally pauses. The pullback after that peak forms the neckline, which is the support area traders watch to judge whether sellers are gaining control.
The second peak should form near the first peak, but it does not need to be identical. Markets rarely create perfect textbook patterns. A slightly higher or lower second peak can still be relevant if it fails near the same resistance zone and then breaks the neckline. Volume can improve the quality of the setup, especially when the second rally is weaker and the neckline break happens with stronger activity.
How to Identify a Double Top Pattern
Start by checking the trend before the pattern. If price has been rising with higher highs and higher lows, a reversal pattern has more context. If price has been moving sideways, be more cautious. Next, mark the first peak and the pullback low. That pullback low becomes the neckline. Then wait for the second rally near the first peak.
The most important step is the break below the neckline. A quick intraday dip below support may not be enough. Traders often look for a close below the neckline, stronger volume, or a retest where the broken neckline acts as resistance.
This is where many false signals appear. If price breaks the neckline briefly and then moves back into the pattern, the setup may have failed. If price breaks above the two peaks instead, the double top is invalidated and the earlier uptrend may continue.
How Traders Use the Pattern
There are two common ways to interpret a double top. The aggressive approach is to act soon after price breaks below the neckline. The more patient approach is to wait for a retest of the neckline from below and then look for bearish confirmation.
The patient approach can reduce some false-breakdown risk, but it may also miss fast moves. The aggressive approach can capture the move earlier, but it may face more failed breakouts. The choice depends on the trader’s timeframe, instrument, liquidity, and risk plan.
The stop-loss is often placed above the second peak or above the resistance zone, depending on the trader’s method. The invalidation point should be clear before entering any trade. For targets, many traders measure the distance between the peak area and the neckline, then project that distance downward from the neckline. This measured move is only a reference point, not a guaranteed target.
Example of a Double Top in an Indian Market Context
Suppose a stock rallies from ₹920 to ₹1,050 and then pulls back to ₹1,000. The ₹1,050 area becomes the first peak, and ₹1,000 becomes the neckline. The stock then rises again to ₹1,045 but cannot break above the earlier resistance. If it closes below ₹1,000 with stronger volume, traders may read the chart as a confirmed double top.
The pattern height is around ₹50. A measured-move reference would project ₹50 below the neckline, giving ₹950 as a possible downside reference. This does not mean the stock must reach ₹950. It only gives a structured way to think about reward, risk, and nearby support zones.
In index trading, the same logic can apply to Nifty, Bank Nifty, or sector indices. If an index repeatedly fails near resistance and then closes below support between the peaks, traders may study whether momentum, volume, open interest, or market breadth supports the reversal view.
Reliability and False Signals
A double top is useful because it forces us to define resistance, support, confirmation, invalidation, and target zones. That structure is valuable, but the pattern can still fail. False signals often happen when the market is in a strong broader uptrend. Price may pause near resistance, create two similar highs, dip below a short-term support level, and then recover quickly.
Timeframe also matters. A double top on a five-minute chart may be relevant for an intraday trader but meaningless for a positional trader. RSI divergence, MACD weakness, falling volume on the second rally, or a strong-volume neckline break may improve confidence. They should still be treated as supporting evidence, not certainty.
Double Top vs Double Bottom
A double top is bearish and appears after an uptrend. It shows that price failed twice near resistance and then broke below support. A double bottom is the opposite pattern. It appears after a downtrend and suggests that price failed twice near support before breaking above resistance. A double top resembles an M, while a double bottom resembles a W. Both patterns need confirmation.
Double Top vs Head and Shoulders
A head-and-shoulders pattern also signals a possible bearish reversal after an uptrend, but its structure is different. It has three peaks: a left shoulder, a higher head, and a right shoulder. A double top has two main peaks near the same price level. The double top is simpler to identify, but that simplicity can also create more subjective readings.
Using the Double Top in a Trading Workflow
A practical workflow starts with the question: is the market actually in an uptrend? If yes, mark the resistance area, neckline, and second peak. Then check whether the neckline breaks with enough evidence to support the reversal view. Before entering a trade, define the invalidation level, target reference, nearby support levels, and position size.
For F&O traders, the double top may be used as one input in a broader strategy. A trader studying a bearish index view might also look at option chain data, open interest shifts, implied volatility, expiry, and event risk. The chart pattern gives direction and structure, but derivatives positions add risks around time decay, margin, volatility, and execution.
Use Nubra Charts to review the two peaks, neckline and any breakdown or retest. For an options setup, Nubra Option Chain provides strike-level open interest, implied volatility and Greeks, while Nubra Strategy Builder supports payoff-scenario review. These tools help assess the setup and its risks; they do not make a double top certain or remove market risk.
Key Takeaways
The double top pattern is a bearish reversal setup that forms after an uptrend.
The two peaks should appear near the same resistance area, with a trough between them.
The neckline break is the main confirmation point. Without it, the chart may only be consolidating.
Volume, momentum indicators, and broader market context can help validate the setup, but they do not guarantee the outcome.
For Indian stocks, indices, and F&O workflows, the pattern should be used as part of a broader analysis process rather than a standalone trading signal.
FAQs
Is the double top pattern bullish or bearish?
The double top pattern is generally bearish. It suggests that price failed twice near a resistance area and may reverse lower if it breaks below the neckline.
When is a double top confirmed?
A double top is usually confirmed when price breaks below the neckline, which is the support area formed by the pullback between the two peaks. Many traders prefer confirmation through a closing break, higher volume, or a retest of the neckline.
Does a double top always lead to a fall?
No. A double top can fail, especially in a strong broader uptrend. Price may break the neckline briefly and then recover, or it may break above the resistance area and continue higher.
What is the target for a double top pattern?
A common target method measures the distance between the peak area and neckline, then projects that distance downward from the neckline. This is only a reference, not a guaranteed price target.
What is the difference between a double top and a double bottom?
A double top forms after an uptrend and signals a possible bearish reversal. A double bottom forms after a downtrend and signals a possible bullish reversal. The double top resembles an M, while the double bottom resembles a W.
Can the double top pattern be used in intraday trading?
Yes, traders may study double tops on intraday charts, but shorter timeframes can produce more noise and false signals. Intraday traders should use confirmation, liquidity checks, and strict risk controls.
Disclaimer: The information provided in this blog is for educational and informational purposes only and should not be construed as investment advice, financial advice, or a recommendation to buy, sell, or hold any securities or financial products. Investments in the securities market are subject to market risks. Please read all related documents carefully before investing. Readers should conduct their own research and consult a SEBI-registered investment adviser or other qualified financial professional before making any investment decisions. Past performance is not indicative of future results.