A double bottom pattern is a bullish reversal chart pattern that forms after a downtrend. It shows that price has tested a support zone twice, failed to break meaningfully lower, and then started moving back toward resistance. On a chart, it often looks like the letter W. For traders, the double bottom turns a messy…
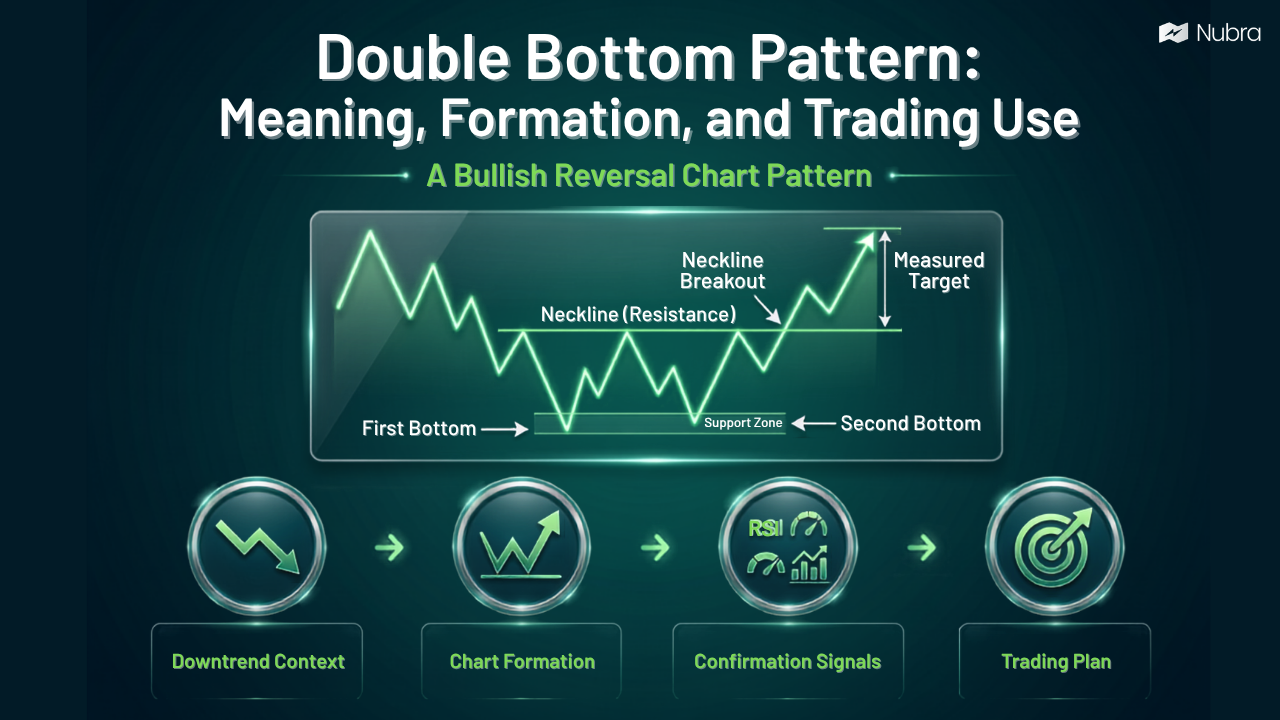
A double bottom pattern is a bullish reversal chart pattern that forms after a downtrend. It shows that price has tested a support zone twice, failed to break meaningfully lower, and then started moving back toward resistance. On a chart, it often looks like the letter W.
For traders, the double bottom turns a messy reversal attempt into a structured question: has selling pressure weakened, or is the market only pausing before continuing lower? The answer depends on confirmation. The pattern is usually taken more seriously after price breaks above the neckline, the resistance level formed by the rebound between the two lows.
This page is educational, not investment advice. Chart patterns can help traders organise price action, but they do not guarantee outcomes.
What is a Double Bottom Pattern?
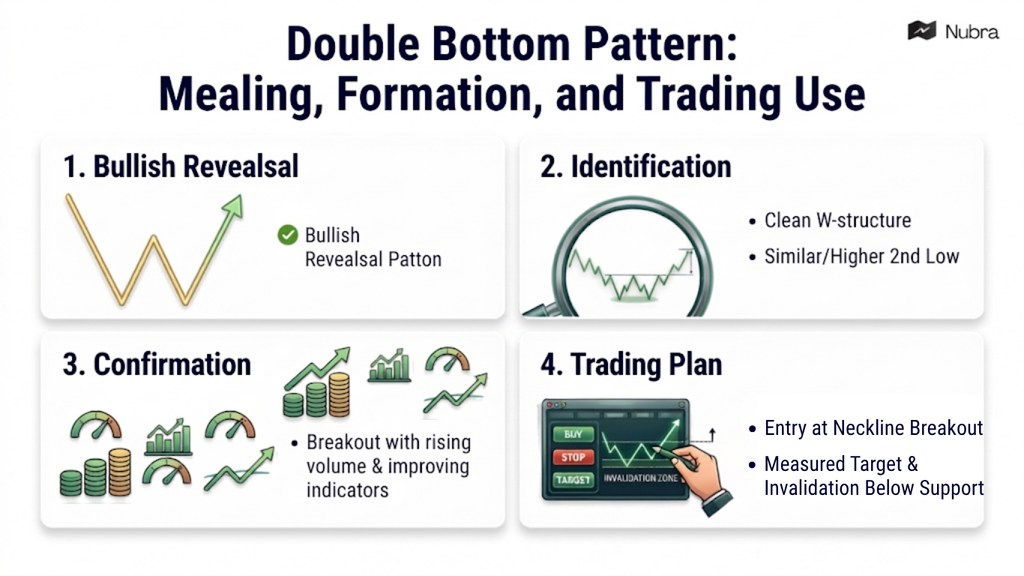
A double bottom pattern appears when a stock, index, commodity, currency pair, or derivative-linked chart moves through five stages:
- Price falls in an existing downtrend.
- Price reaches a low and rebounds.
- The rebound forms a swing high or resistance level.
- Price falls again and tests a similar low.
- Price rises and breaks above the resistance level between the two lows.
The two lows create the support zone. The middle high creates the neckline. The pattern is considered incomplete until the price breaks above that neckline with reasonable confirmation.
For example, suppose Nifty falls from 22,400 to 21,900, rebounds to 22,200, falls again near 21,900, and then closes above 22,200. The two tests near 21,900 show that sellers struggled to push lower, while the close above 22,200 gives traders a defined level to study.
What the Pattern Shows About Market Behaviour
The double bottom is not just a shape. It reflects a shift in the buyer-seller balance.
The first bottom forms after a decline, when selling pressure is still visible. The rebound may be short covering, bargain buying, or only a temporary pause in the downtrend.
The second bottom is more important. When price returns to the earlier support zone and does not break down decisively, sellers may be losing strength. If the next rally clears the neckline, the market is no longer only respecting support; it is breaking resistance.
This is why every W-shaped move should not be called a double bottom too early. Without neckline confirmation, the second low can still fail and the prior downtrend can resume.
How to Identify a Double Bottom Pattern
Start with the trend before looking for the pattern. A valid double bottom normally appears after a clear downward move. If the market has been moving sideways, two similar lows may simply be part of a range, not a reversal pattern.
Next, look at the lows. They do not have to be identical, but they should be close enough to represent the same support zone. A higher second low can be constructive; a lower second low needs more caution and stronger confirmation.
The neckline is the high made between the two bottoms. For bullish confirmation, traders usually look for a close above this level rather than only an intraday spike.
Volume can add context. A stronger setup often has heavy activity around the first sell-off, lighter selling near the second bottom, and rising volume during the breakout.
Double Bottom Pattern Formation
The cleaner the structure, the easier it is to plan around. A pattern spread across several sessions on a daily chart often carries more weight than a quick intraday pattern inside noisy price action. Still, traders need to consider the broader trend, liquidity, news events, volatility, and risk-reward.
How Traders Commonly Use the Double Bottom Pattern
The most common approach is to wait for a neckline breakout. Before that, the chart may only be showing support. After the breakout, the structure gives three reference points: entry zone, invalidation zone, and measured target.
The entry zone is usually around the neckline breakout or a retest of the neckline after breakout. Some traders prefer the first close above the neckline; others wait for a pullback toward the neckline.
The invalidation zone is usually below the second bottom or below the broader support zone. If price breaks below that area, the pattern has failed because the support thesis no longer holds.
The measured target is commonly calculated by taking the distance between the neckline and the bottom, then projecting that distance above the neckline.
For example, if support is near 21,900 and the neckline is 22,200, the pattern height is 300 points. Adding 300 points to the neckline gives a measured target near 22,500. This is only a planning reference. It helps compare potential reward with defined risk; it does not predict the future with certainty.
Confirmation Signals to Check
A double bottom is stronger when multiple pieces of evidence point in the same direction. The neckline breakout is the central signal, but traders often combine it with:
- Rising volume on the breakout.
- A higher low on the second bottom.
- Momentum improvement through RSI, MACD, or similar indicators.
- Price reclaiming a key moving average.
- A broader market or sector setup that supports a reversal.
- A clean retest of the neckline after breakout.
In Indian markets, a trader studying a double bottom in a stock may also check the related index, sector trend, futures build-up, option chain levels, and open interest activity.
Why Double Bottom Patterns Can Fail
The biggest issue with a double bottom is early interpretation. If the price does not break the neckline, the chart may still be in a downtrend or a sideways range.
False breakouts are another risk. Price can close above the neckline and then quickly fall back below it, especially in volatile markets or near major events. A good-looking pattern with poor risk-reward can still be a weak trade.
It also helps to avoid forcing the pattern onto every chart. If the lows are too far apart, the neckline is unclear, or the trend context is missing, the setup becomes subjective.
How Nubra Fits Into This Workflow
Use Nubra Charts to review the two lows, neckline, breakout and subsequent price action. For an options setup, Nubra Option Chain provides strike-level open interest, implied volatility and Greeks, while Nubra Strategy Builder helps compare payoff scenarios. Treat these as inputs to confirmation and risk review, not as proof that the reversal will succeed.
The pattern itself should remain only one input. Traders still need to define invalidation, estimate risk-reward, and decide whether the setup fits their own process. Tools can support analysis and planning, but they do not remove market risk.
Bottom Line
The double bottom pattern helps traders study a possible shift from bearish pressure to bullish recovery. It is built around two tests of support, a neckline, and a breakout above that neckline.
Used well, the pattern encourages patience. Instead of reacting to the first bounce, traders wait for the market to show whether support is holding and whether buyers can clear resistance.
FAQs
Is a double bottom pattern bullish or bearish?
A double bottom is generally treated as a bullish reversal pattern. It forms after a downtrend and becomes stronger only after price breaks above the neckline.
When is a double bottom pattern confirmed?
The pattern is usually confirmed when price closes above the neckline. Traders often look for supporting volume or momentum confirmation before trusting the breakout.
Do both bottoms need to be at the exact same price?
No. The two lows should be near the same support zone, but they do not need to match exactly.
How is the target calculated in a double bottom pattern?
The common measured-move method is to calculate the distance between the bottom and the neckline, then add that distance above the neckline.
Where is the stop-loss usually placed?
Many traders place the stop-loss below the second bottom or below the wider support zone.
Can a double bottom pattern fail?
Yes. A double bottom can fail if price breaks below support, if the neckline breakout reverses quickly, or if broader market conditions remain weak.
Disclaimer: The information provided in this blog is for educational and informational purposes only and should not be construed as investment advice, financial advice, or a recommendation to buy, sell, or hold any securities or financial products. Investments in the securities market are subject to market risks. Please read all related documents carefully before investing. Readers should conduct their own research and consult a SEBI-registered investment adviser or other qualified financial professional before making any investment decisions. Past performance is not indicative of future results.