When price moves sharply, we can miss the detail between the starting point and the finish. A fair value gap helps us mark part of that move and study what happens if price returns. We’ll work through the pattern, a rupee-based example and its limitations. The aim is to read the chart clearly, without treating…
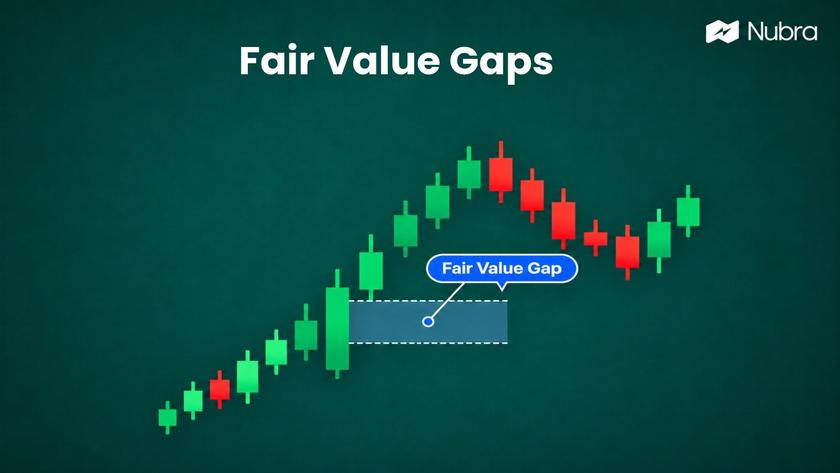
When price moves sharply, we can miss the detail between the starting point and the finish. A fair value gap helps us mark part of that move and study what happens if price returns.
We’ll work through the pattern, a rupee-based example and its limitations. The aim is to read the chart clearly, without treating a marked zone as a promise of what comes next.
What is a Fair Value Gap?
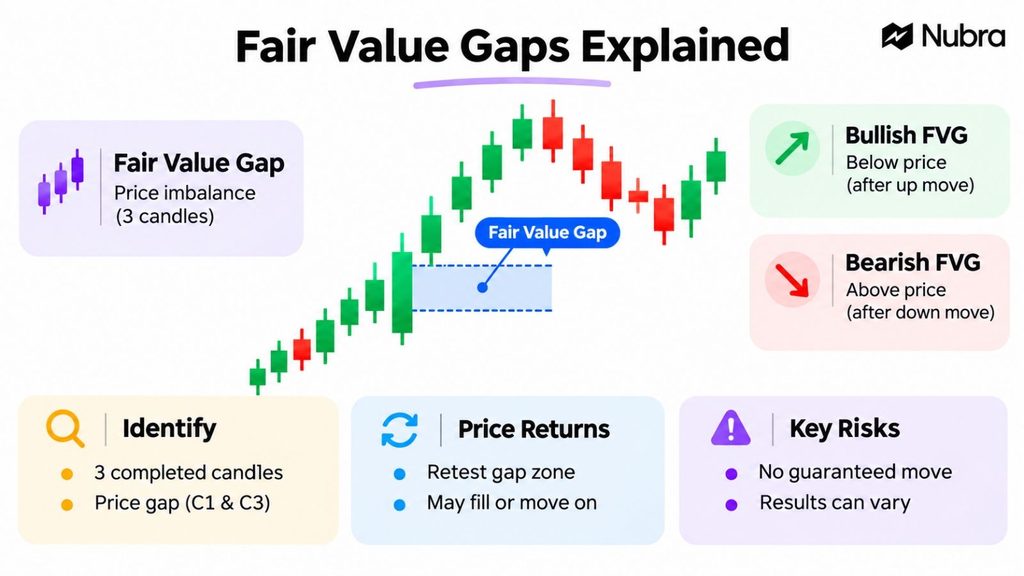
A fair value gap (FVG) is a three-candle chart pattern where the price ranges of the first and third candles leave a space between them, alongside a strong middle candle.
We mark that space using the outer candles’ wicks. Traders often describe it as an imbalance after a sharp move. However, the middle candle can trade through those prices. The pattern does not prove that no transactions occurred there or reveal who placed the orders.
“Fair value” here is chart terminology, rather than a calculation of a company’s underlying worth.
How Do We Identify a Fair Value Gap?
We start with three consecutive, completed candles on the same timeframe. Candle 2 shows the strong move; candles 1 and 3 define the zone. Waiting for candle 3 to close avoids marking a gap that disappears while it is still forming.
If wick and body terminology needs a refresh, our guide to candlestick patterns explains the basics.
Bullish Fair Value Gap
A bullish FVG forms when candle 3’s low is above candle 1’s high after an upward move.
For an illustrative stock example, suppose candle 1 reaches ₹500 and candle 3’s lowest price is ₹506. We mark the zone from ₹500 to ₹506. Its width is ₹6, and its midpoint is ₹503.
If price later falls into that range, we watch whether buying interest returns. Simply touching ₹506 does not confirm that the price will rise.
Bearish Fair Value Gap
A bearish FVG forms when candle 3’s high is below candle 1’s low after a downward move.
Suppose candle 1’s low is ₹500 and candle 3’s high is ₹494. We mark ₹494–₹500. If price later rises into that zone, we assess whether sellers respond or the recovery continues through it.
These examples explain the pattern; they are not trading recommendations.
What Happens When Price Returns to the Gap?
A return to the zone is a retest. Price may enter part of it, cross the whole range or move away without returning at all. A full fill describes price reaching the opposite edge; it does not establish the next direction.
We also need an invalidation rule: the condition that ends the original interpretation. One approach treats a candle close below a bullish gap, or above a bearish gap, as failure. Other methods use different rules, so we define the rule before assessing results.
The surrounding chart matters. A gap near an established level deserves a different assessment from one inside a choppy range. Our guide to trading patterns in charts explains how trend and price structure provide context.
Which Timeframes and Risks Should We Consider?
We can study FVGs on intraday or longer charts. Five-minute and 15-minute charts offer different views, but neither is universally better. We keep the timeframe consistent and check the broader trend before interpreting a small pattern.
A gap alone does not establish a profitable method. Testing needs clear identification, entry, exit and failure rules, alongside brokerage, other charges and slippage. Stop-loss orders cannot guarantee the intended exit price during a fast move.
For options, we also consider expiry, implied volatility and time decay. An index moving in the anticipated direction does not guarantee a profitable option position. Our guide to risk management in options trading covers these additional considerations.
How Can We Study the Setup on Nubra?
We can use Nubra Charts to inspect the price pattern and its wider context. For an options-based analysis, Nubra Option Chain provides strike-level prices, open interest, volume and Greeks.
We can then use Nubra Strategy Builder to examine option combinations and payoff scenarios. These tools support analysis; they do not confirm that an FVG will hold or guarantee an outcome. Access may require signing in.
FAQs
What Does FVG Stand for?
FVG stands for fair value gap, a three-candle pattern identified through non-overlapping ranges of the first and third candles.
Do Fair Value Gaps Always Fill?
No. Price may revisit the whole zone, touch only part of it or continue moving away. We cannot assume a deadline for a fill.
Is an FVG the Same as an Overnight Gap?
No. An overnight gap describes a price jump between sessions. An FVG compares three candles and may form during continuous trading.
What is the Midpoint of an FVG?
It is halfway between the two boundaries. Some traders call it consequent encroachment. It is a reference level, without any assurance of a reaction.
What is an Inverse Fair Value Gap?
After price closes through a gap, some traders watch the zone in the opposite role: former support as resistance, or vice versa. That interpretation can also fail.
Can We Identify FVGs on Nifty Charts?
Yes, using the same three-candle conditions. Nifty levels are expressed in index points; any related option position needs a separate assessment of premium and risk.
Disclaimer: The information provided in this blog is for educational and informational purposes only and should not be construed as investment advice, financial advice, or a recommendation to buy, sell, or hold any securities or financial products. Investments in the securities market are subject to market risks. Please read all related documents carefully before investing. Readers should conduct their own research and consult a SEBI-registered investment adviser or other qualified financial professional before making any investment decisions. Past performance is not indicative of future results.