A rising wedge pattern forms when price makes higher highs and higher lows between two upward-sloping trendlines that move closer together. It has a bearish bias: the advance may be weakening despite rising prices. We look for a break below the lower trendline before interpreting the pattern as a bearish signal. The shape alone does…
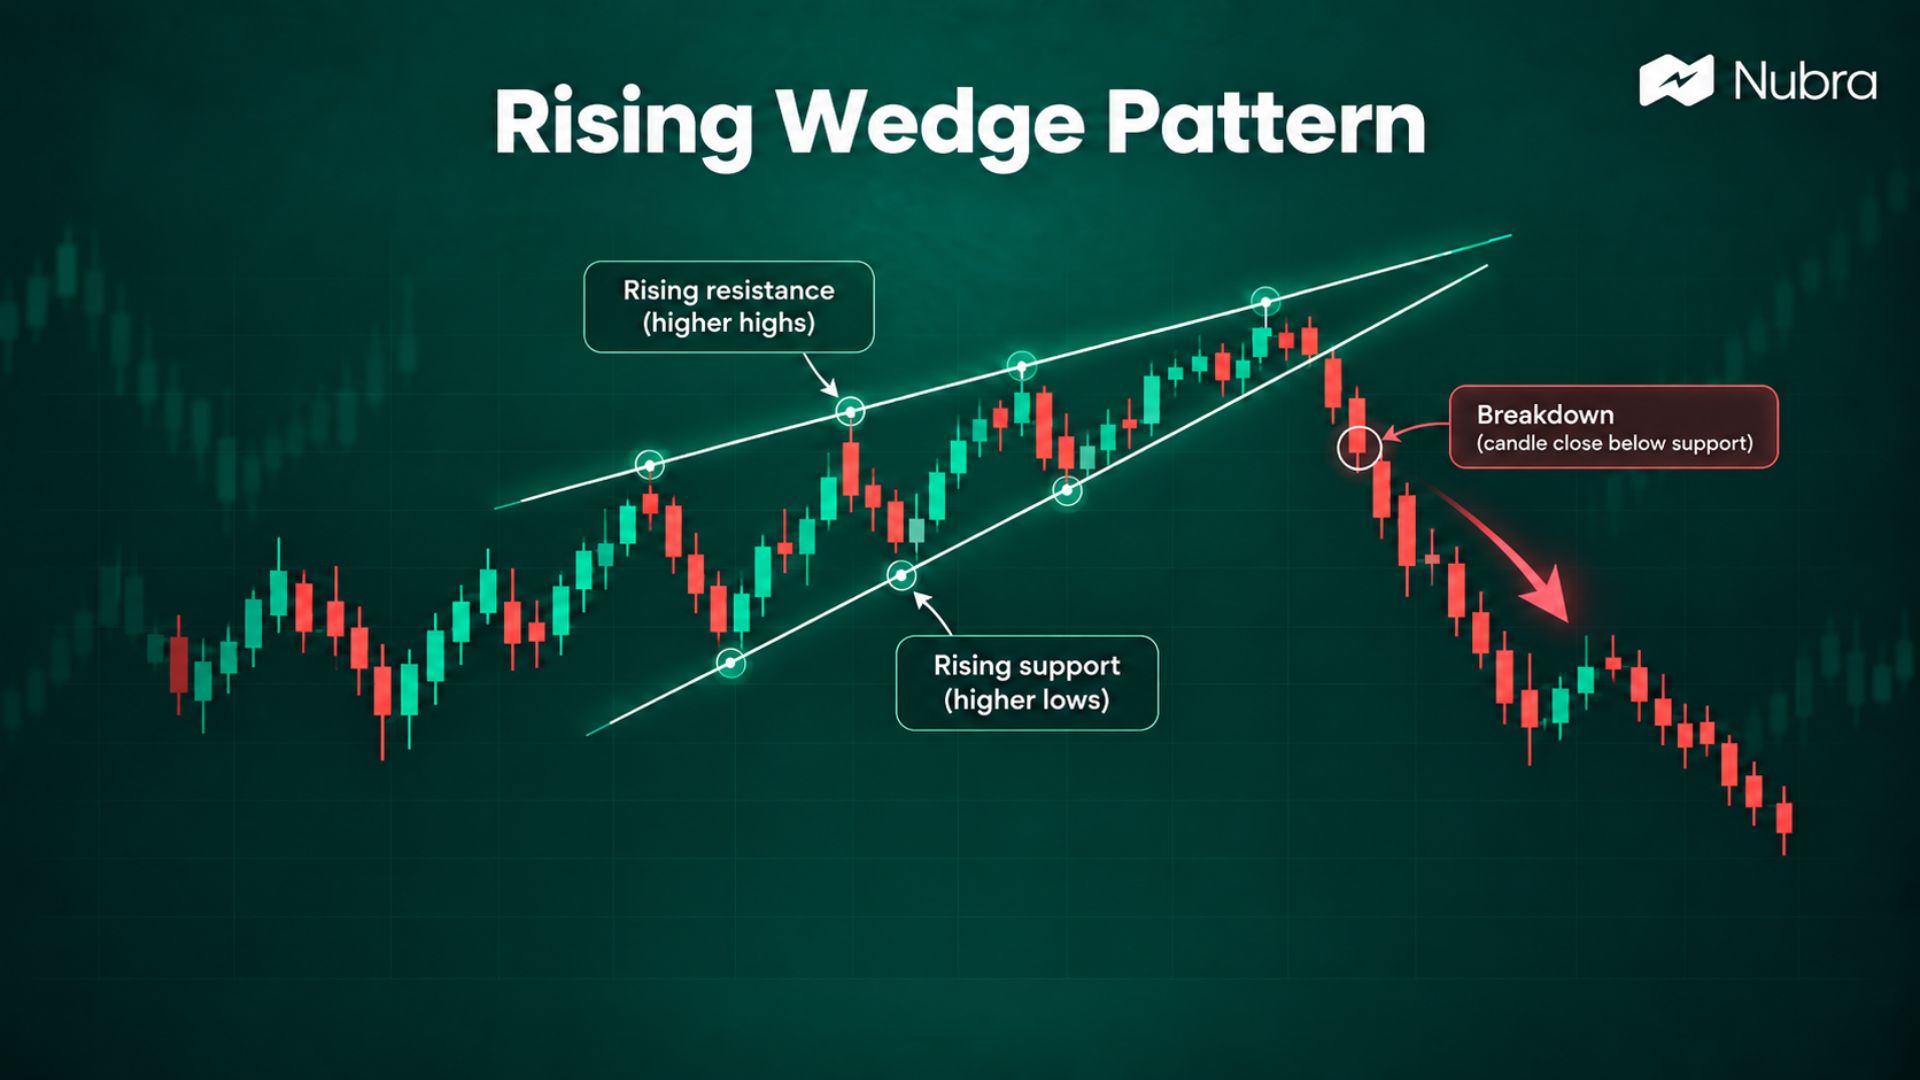
A rising wedge pattern forms when price makes higher highs and higher lows between two upward-sloping trendlines that move closer together. It has a bearish bias: the advance may be weakening despite rising prices.
We look for a break below the lower trendline before interpreting the pattern as a bearish signal. The shape alone does not confirm a reversal.
How Do We Recognise a Rising Wedge?
We connect the swing highs to draw resistance and the swing lows to draw support. Both lines rise, but support rises more steeply, narrowing the gap. We look for at least two clear touches on each line rather than forcing the lines around isolated candles.
The earlier trend changes our interpretation:
• After an uptrend, a downward break may signal a bearish reversal.
• During a downtrend, the wedge may be a temporary rally before the decline resumes.
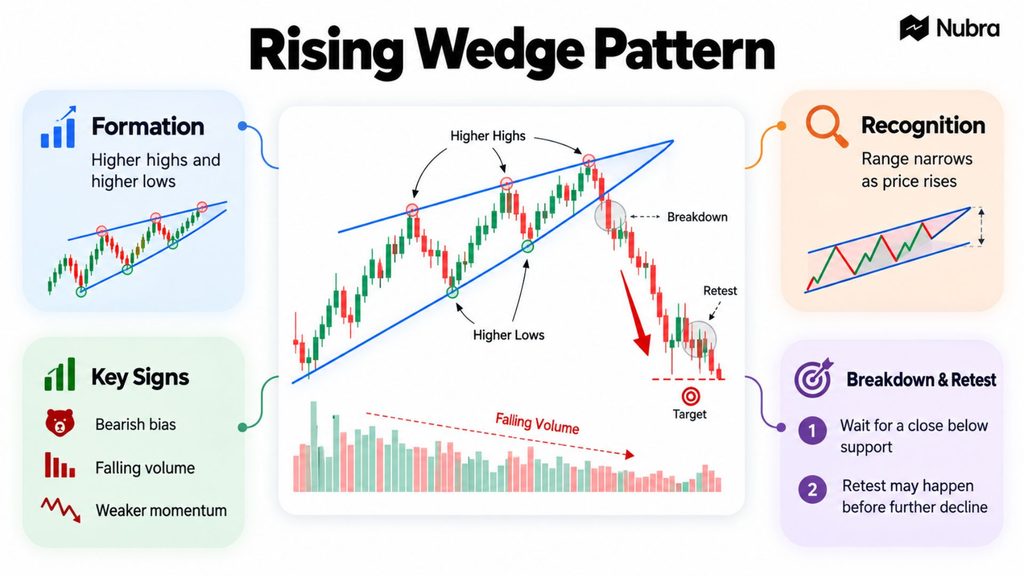
Volume often falls as the wedge develops, suggesting weaker participation. That supports the interpretation, but does not prove buyers have lost control. We can also check momentum through the Relative Strength Index (RSI). A higher price high alongside a lower RSI high suggests weakening momentum, not a certain fall.
How Do We Assess the Breakdown?
We look for a candle close below support on the timeframe being analysed. A brief move below the line can reverse before the candle closes. Higher volume on the break can add supporting evidence; a return inside the wedge weakens the signal.
Price sometimes returns to test the broken support as resistance. We can study that retest, but it may never happen. Waiting for confirmation also does not remove the risk of a false breakdown.
Consider a hypothetical stock with a wedge whose widest vertical gap is ₹20. If support breaks at ₹510, subtracting that gap gives a reference target of ₹490. This measured move is an estimate, not a forecast. Nearby support may interrupt the decline.
We also identify where the bearish interpretation would fail, such as a move above a relevant swing high. That informs stop-loss planning and position size. Actual losses can exceed the planned amount because of gaps or slippage.
Reviewing the Setup With Nubra
We can examine the price structure on Nubra Charts. For an options-based assessment, Nubra’s Option Chain provides contract context, while Nubra’s Strategy Builder helps us build multi-leg combinations. Some tools require sign-in.
Nubra’s option chain guide explains the data before we apply it. A bearish chart pattern alone does not determine which option contract or strategy is suitable; these tools support analysis without guaranteeing outcomes.
FAQs
Can a Rising Wedge Break Upwards?
Yes. We treat the pattern as a bearish possibility, not a fixed outcome. A sustained break above resistance challenges that interpretation.
How Does it Differ From a Falling Wedge?
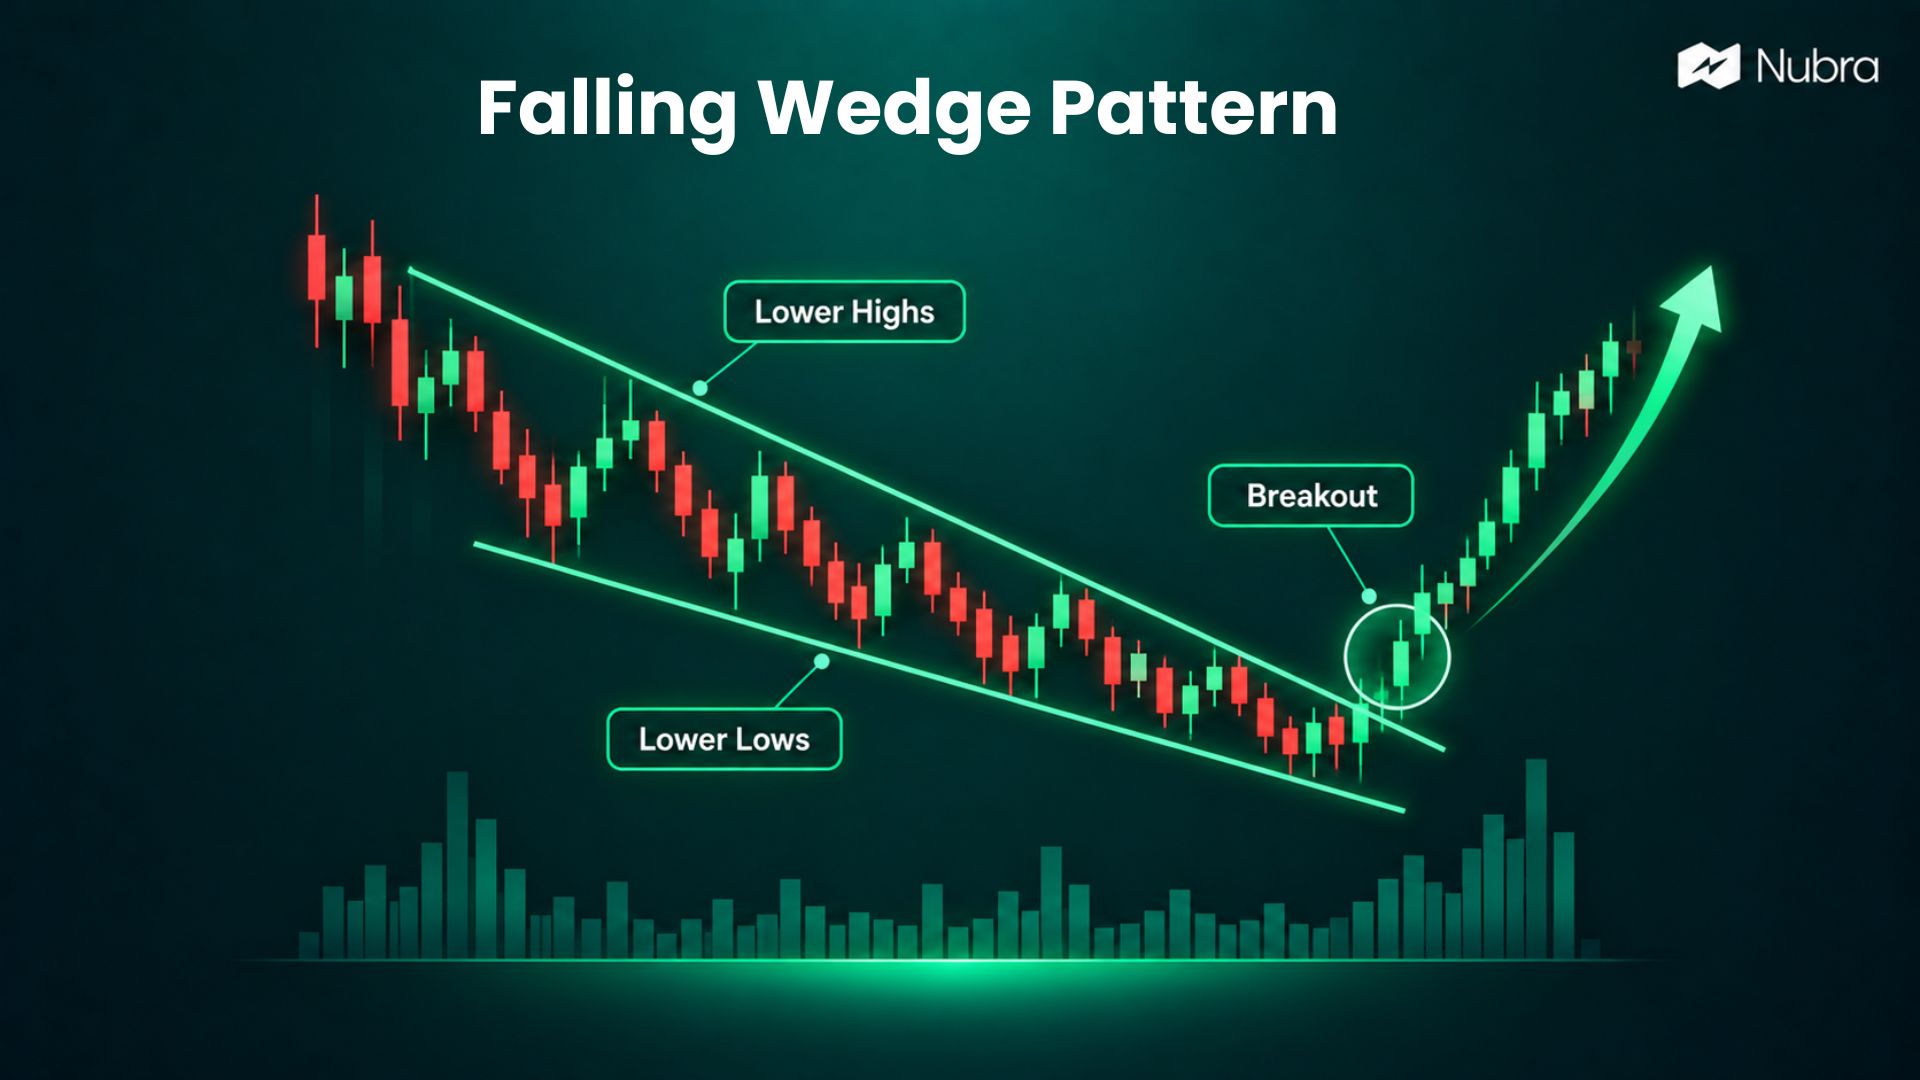
A rising wedge slopes upwards and has a bearish bias. A falling wedge pattern slopes downwards and has a bullish bias. In both cases, we assess the breakout before drawing conclusions.
What Confirms a Rising Wedge Breakdown?
We look for a candle close below the lower support line. Higher volume can strengthen the signal, but false breakdowns remain possible.
Is a Rising Wedge Always a Reversal Pattern?
No. We may see it after an uptrend as a potential reversal, or during a downtrend as a temporary rally before further weakness.
How Do We Estimate a Rising Wedge Target?
We subtract the wedge’s widest vertical gap from the breakdown price. This gives a reference target, not a guaranteed destination; nearby support may limit the move.
Disclaimer: The information provided in this blog is for educational and informational purposes only and should not be construed as investment advice, financial advice, or a recommendation to buy, sell, or hold any securities or financial products. Investments in the securities market are subject to market risks. Please read all related documents carefully before investing. Readers should conduct their own research and consult a SEBI-registered investment adviser or other qualified financial professional before making any investment decisions. Past performance is not indicative of future results.