A dragonfly doji is a T-shaped candlestick with a long lower wick and little or no body. Its opening and closing prices sit close to the candle’s high. It shows that price fell during the period but recovered before the close. When we see this pattern after a decline, it can suggest that selling pressure…
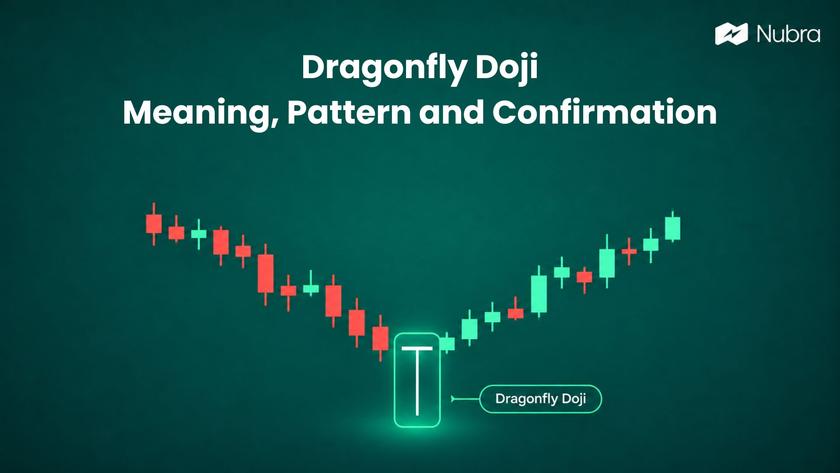
A dragonfly doji is a T-shaped candlestick with a long lower wick and little or no body. Its opening and closing prices sit close to the candle’s high. It shows that price fell during the period but recovered before the close.
When we see this pattern after a decline, it can suggest that selling pressure is meeting buying interest. It does not establish that a reversal has begun. To understand it, we need to look at where it forms and what price does next.
What Does a Dragonfly Doji Look Like?
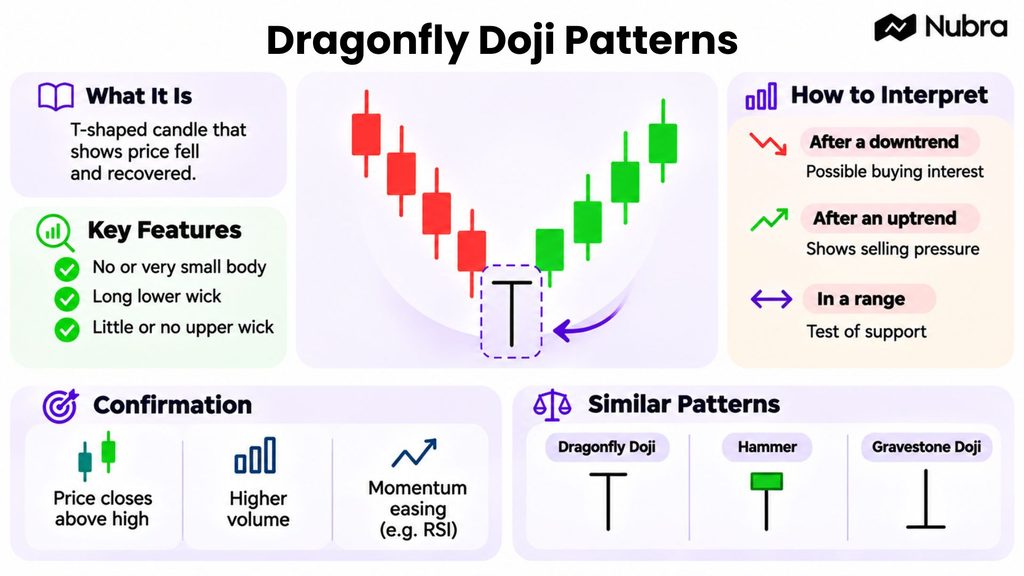
We can identify a dragonfly doji by checking three features:
- The opening and closing prices are the same or very close, leaving almost no body.
- A long lower wick extends beneath that body.
- The upper wick is absent or very short.
The wick, also called a shadow, marks the distance price travelled beyond the body. In an ideal dragonfly doji, the open, high and close coincide. Small differences can occur on actual charts, so we assess the shape alongside nearby candles rather than expect a perfect drawing.
The long lower wick shows that the market traded at lower prices and recovered. It does not reveal exactly who bought, why they bought, or whether their interest will continue.
For a broader comparison of candle shapes, our guide to candlestick patterns explains how bodies and wicks differ.
How Do We Interpret the Pattern?
A dragonfly doji needs context. The same candle can raise different questions in a falling market, a rising market or a sideways range.
After a downtrend, particularly near previous support, the recovery can indicate that sellers are struggling to hold lower prices. Support is an area where buying has previously helped interrupt a decline. We still need evidence that buyers can sustain the recovery.
After an uptrend, the lower wick shows that selling pressure appeared during the period. That deserves attention, but it does not make the candle an automatic bearish signal. Subsequent weakness is needed before discussing a possible downward reversal.
Inside a sideways range, the pattern may simply reflect another test of the range’s lower boundary. Calling every dragonfly doji a reversal overlooks whether there was a clear trend to reverse.
What Confirmation Should We Look for?
We can organise the next checks around price, participation and momentum:
- Price: a later candle closing above the doji’s high can support the bullish interpretation after a decline. A brief move above the high that fades before the close provides less convincing follow-through.
- Participation: compare trading volume with recent periods where volume data is available. A recovery supported by participation adds context, but high volume alone cannot establish direction.
- Momentum: indicators can help us examine whether selling pressure is easing. Our guide to the Relative Strength Index explains why an oversold reading does not automatically mean a rebound is due.
We should also wait for the candle itself to finish forming. A T-shaped candle can change substantially before its period ends. Confirmation adds evidence; it does not remove the possibility of failure.
A Dragonfly Doji Example in ₹
Suppose a hypothetical share has declined towards a previous support area. It opens at ₹500, falls to ₹480, reaches a high of ₹500 and closes at ₹500. That creates a dragonfly doji with a ₹20 lower wick.
If the next candle closes at ₹506, above the doji’s high, we have follow-through consistent with a possible bullish reversal. If price instead breaks below ₹480, the initial rejection has failed to hold.
Neither outcome was certain when the doji formed. These are illustrative prices, not a recommendation involving any security.
The pattern also provides no fixed price target. We need to consider nearby resistance, the distance to a possible exit and how much capital would be exposed. A long lower wick may leave a wide distance between an entry and an invalidation level, making the potential loss substantial.
Our explanation of stop-loss orders covers another practical limit: gaps and execution conditions can cause the actual exit price to differ from the intended level.
Dragonfly Doji, Hammer and Gravestone Doji
We can distinguish these similar patterns by looking at the body and the direction of the wick.
A dragonfly doji has almost no body at the top and a long lower wick. A hammer has a small but visible body near the top, also with a long lower wick. Both are studied after declines, with attention to support and subsequent price action.
A gravestone doji has almost no body near the bottom and a long upper wick. It records a move higher that was not sustained into the close.
The shape describes what happened within a period. It cannot, by itself, tell us what the next period will bring.
Reviewing the Setup With Nubra Tools
Once we understand the candle, we can put it into a wider analysis:
- Nubra Charts helps us examine the pattern alongside the underlying price action and nearby levels.
- Nubra Option Chain provides strike-level information, including open interest, implied volatility and Greeks, for options analysis.
- Nubra Strategy Builder supports reviewing payoff scenarios for options strategies.
Charts and Strategy Builder require sign-in. These tools support analysis rather than establish that a reversal will occur. For options, a view on the underlying also needs consideration of expiry, liquidity and how the contract’s price responds to changing conditions.
FAQs
Is a Dragonfly Doji Bullish or Bearish?
After a decline, it can suggest a potential bullish reversal. After a rally, it can flag emerging selling pressure. We need subsequent price action to assess either interpretation.
Does a Longer Lower Wick Mean a Stronger Signal?
It shows a larger recovery from the low. Length alone does not establish reliability; the trend, location and follow-through still matter.
Does the Candle’s Colour Matter?
The near-equal open and close matter more than colour. Small price differences may make the candle appear red or green without changing its basic structure.
Can We Use it Without Confirmation?
The candle alone gives limited evidence. Waiting for follow-through helps us assess whether the recovery continues, although a confirmed setup can still fail.
Does a Dragonfly Doji Appear on Intraday Charts?
Yes. We can identify it on intraday and longer-period charts. Shorter periods can contain more noise, making context particularly important.
What is its Success Rate?
There is no universal success rate. Any figure depends on the market, timeframe, identification rules and entry and exit assumptions used in the test.
Disclaimer: The information provided in this blog is for educational and informational purposes only and should not be construed as investment advice, financial advice, or a recommendation to buy, sell, or hold any securities or financial products. Investments in the securities market are subject to market risks. Please read all related documents carefully before investing. Readers should conduct their own research and consult a SEBI-registered investment adviser or other qualified financial professional before making any investment decisions. Past performance is not indicative of future results.