Daily Nifty analysis is not just about asking whether the market will go up or down tomorrow. A useful analysis helps a trader understand four things: where the trend is, where the index can pause, what the option chain is suggesting, and what would prove the view wrong. That last question matters the most. If […]
Daily Nifty Analysis
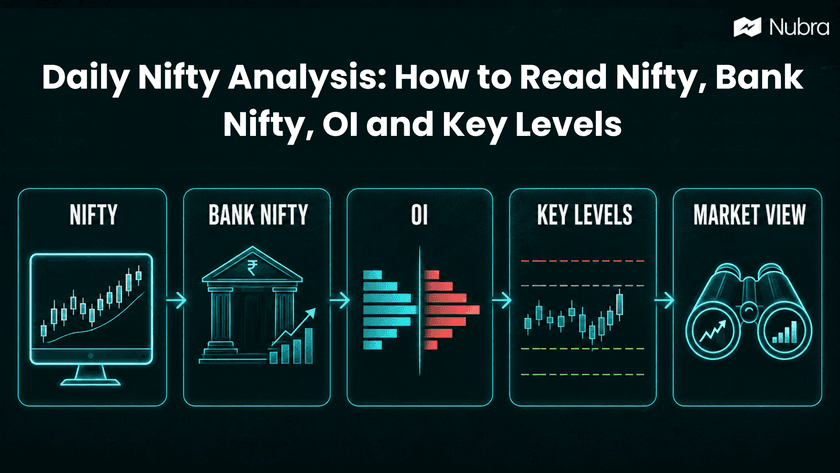
Daily Nifty analysis is not just about asking whether the market will go up or down tomorrow. A useful analysis helps a trader understand four things: where the trend is, where the index can pause, what the option chain is suggesting, and what would prove the view wrong.
That last question matters the most. If Nifty is moving inside a 24,000 to 24,200 range, every 40-point move should not be treated as a breakout. The better question is whether price is accepting above resistance, whether OI is shifting with the move, and whether Bank Nifty is confirming the same direction.
This page explains a daily Nifty analysis framework for active Indian traders. It is educational, not investment advice. The examples are meant to show how market data can be read before forming a trade plan.
Start With Market Structure
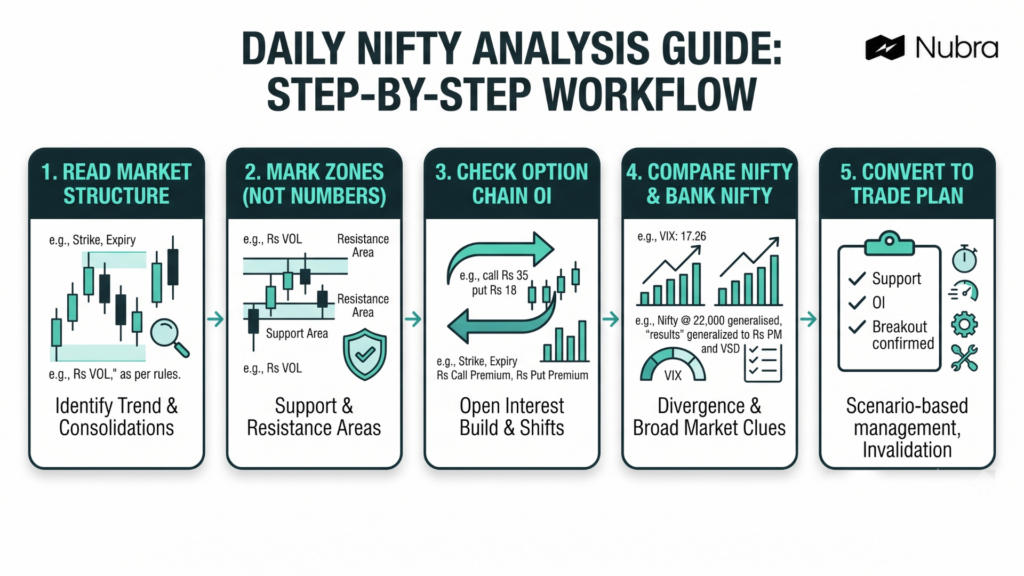
The first step is to compare Nifty with the previous session’s high, low, close, and recent swing zones. Before opening the option chain, it helps to know whether the index is trending, consolidating, or reacting from an important level.
If Nifty has spent several sessions between 23,800 and 24,200, that area can be treated as a range until price proves otherwise. A move above 24,200 is not enough by itself. The move becomes more meaningful only if the index sustains above that zone and pullbacks hold.
The same applies on the downside. If 23,800 has acted as support more than once, a bearish view needs either a decisive breakdown or repeated rejection from lower highs.
Mark Zones, Not Exact Numbers
Support and resistance are better treated as areas. A level like 24,200 may matter, but the market rarely respects a single number perfectly.
Here is a simple way to read it:
| Market area | What to watch | What it may suggest |
|---|---|---|
| Above resistance | Sustained candles, pullback holding, volume or OI support | Buyers may be accepting higher prices |
| At resistance | Rejections, wicks, failed follow-through | The breakout may need more confirmation |
| Inside range | Choppy price, quick reversals, mixed OI | Better to reduce directional assumptions |
| Below support | Sustained breakdown, weak bounce, call writing pressure | Sellers may be gaining control |
This gives the analysis a clean map: bullish above this zone, bearish below that zone, and cautious inside the middle.
Use Option Chain Data As Confirmation
For Nifty options, open interest can add useful context. If heavy call OI is building near 24,200, that area may act as potential resistance. If put OI is building near 24,000, that area may act as potential support. But OI should not be read as a prediction engine.
OI shows where market participants are positioned. It does not guarantee that a level will hold. That is why OI should be combined with price action. If Nifty is near resistance and call OI remains heavy while price keeps rejecting the zone, the market is giving useful context. If price breaks above resistance and call OI starts unwinding, the structure may be changing.
PCR, max pain, IV, and OI change can also help, but they work better as context rather than commands. The real question is whether the data supports what price is already showing.
Compare Nifty With Bank Nifty
Nifty and Bank Nifty do not need to move in perfect sync, but divergence should not be ignored. If Nifty is trying to break out while Bank Nifty is stuck below resistance, the setup needs more selectivity. If both indices break important zones together, the move deserves more attention.
For example, if Nifty moves above 24,200 but Bank Nifty fails to cross its own resistance zone, it is better not to assume broad market strength too early.
This is where a daily routine helps. A trader can check the index chart, sector behaviour, option chain, and intraday breadth before forming a view.
Convert Analysis Into A Trade Plan
A useful daily Nifty analysis should end with a plan, not a prediction. One practical format is:
| Scenario | What to look for | How to manage the view |
|---|---|---|
| Bullish continuation | Nifty sustains above resistance and pullbacks hold | Avoid chasing; wait for confirmation and define invalidation |
| Range-bound session | Price stays between support and resistance | Reduce directional bias; watch mean-reversion risk |
| Bearish breakdown | Nifty fails support and bounce attempts stay weak | Track whether OI shifts and avoid late entries |
This keeps the analysis disciplined. If the view is bullish above 24,200, then a move back below that zone shows the idea is weakening. If the view is range-bound, then a clean breakout is a signal to stop treating the market as sideways.
It also helps to decide what not to trade. If the index opens in the middle of the range with no clear OI shift, waiting may be better than forcing a view. Not every session needs a trade.
Where Nubra Fits In The Workflow
For a trader, the value of a daily Nifty analysis workflow is in seeing the full picture quickly: chart structure, option chain, OI change, volatility, possible strategy impact, and risk before execution. Nubra can support this kind of product-led workflow for traders who want to study F&O data, compare scenarios, and plan more deliberately.
The important point is restraint. A platform can help traders analyse levels and strategy scenarios, but it cannot remove market risk. Trading outcomes still depend on market conditions, execution, position sizing, and user decisions.
That is the mindset daily Nifty analysis should build. Instead of a headline that says the market will definitely move to a certain level, the reader needs a structured view: here is the trend, here are the zones, here is what OI is suggesting, here is where the view fails, and here is how to respond if the market does something different.
FAQs
What is daily Nifty analysis?
Daily Nifty analysis is the process of reviewing price action, support and resistance, option chain, OI, volatility, and broader market context before the next session.
Which indicators are useful for daily Nifty analysis?
A practical analysis usually starts with price action, previous high and low, support and resistance, moving averages, option-chain OI, PCR, IV, and Bank Nifty confirmation.
How can Nifty support and resistance be found?
Support and resistance can be found by looking at recent swing highs and lows, previous day levels, range boundaries, pivot areas, and option-chain OI concentration.
Is open interest enough to predict Nifty movement?
No. Open interest shows positioning, not certainty. It should be used to confirm or question what price action is showing.
Should Bank Nifty be analysed with Nifty?
Yes, especially for intraday and short-term index trading. If they diverge, it is better to be more cautious and wait for stronger confirmation.
Is this daily Nifty analysis a trading recommendation?
No. This framework is for educational purposes only and should not be treated as investment advice. The examples explain the process; they do not recommend a specific trade.
Disclaimer: The information provided in this blog is for educational and informational purposes only and should not be construed as investment advice, financial advice, or a recommendation to buy, sell, or hold any securities or financial products. Investments in the securities market are subject to market risks. Please read all related documents carefully before investing. Readers should conduct their own research and consult a SEBI-registered investment adviser or other qualified financial professional before making any investment decisions. Past performance is not indicative of future results.
Published Jul 24, 2026