The put-call ratio (PCR) compares put options with call options using either open interest or trading volume. We use it to understand the balance of options activity, then compare that reading with price movement and market conditions. A PCR above 1 means the selected put figure exceeds the call figure. Below 1, the call figure…
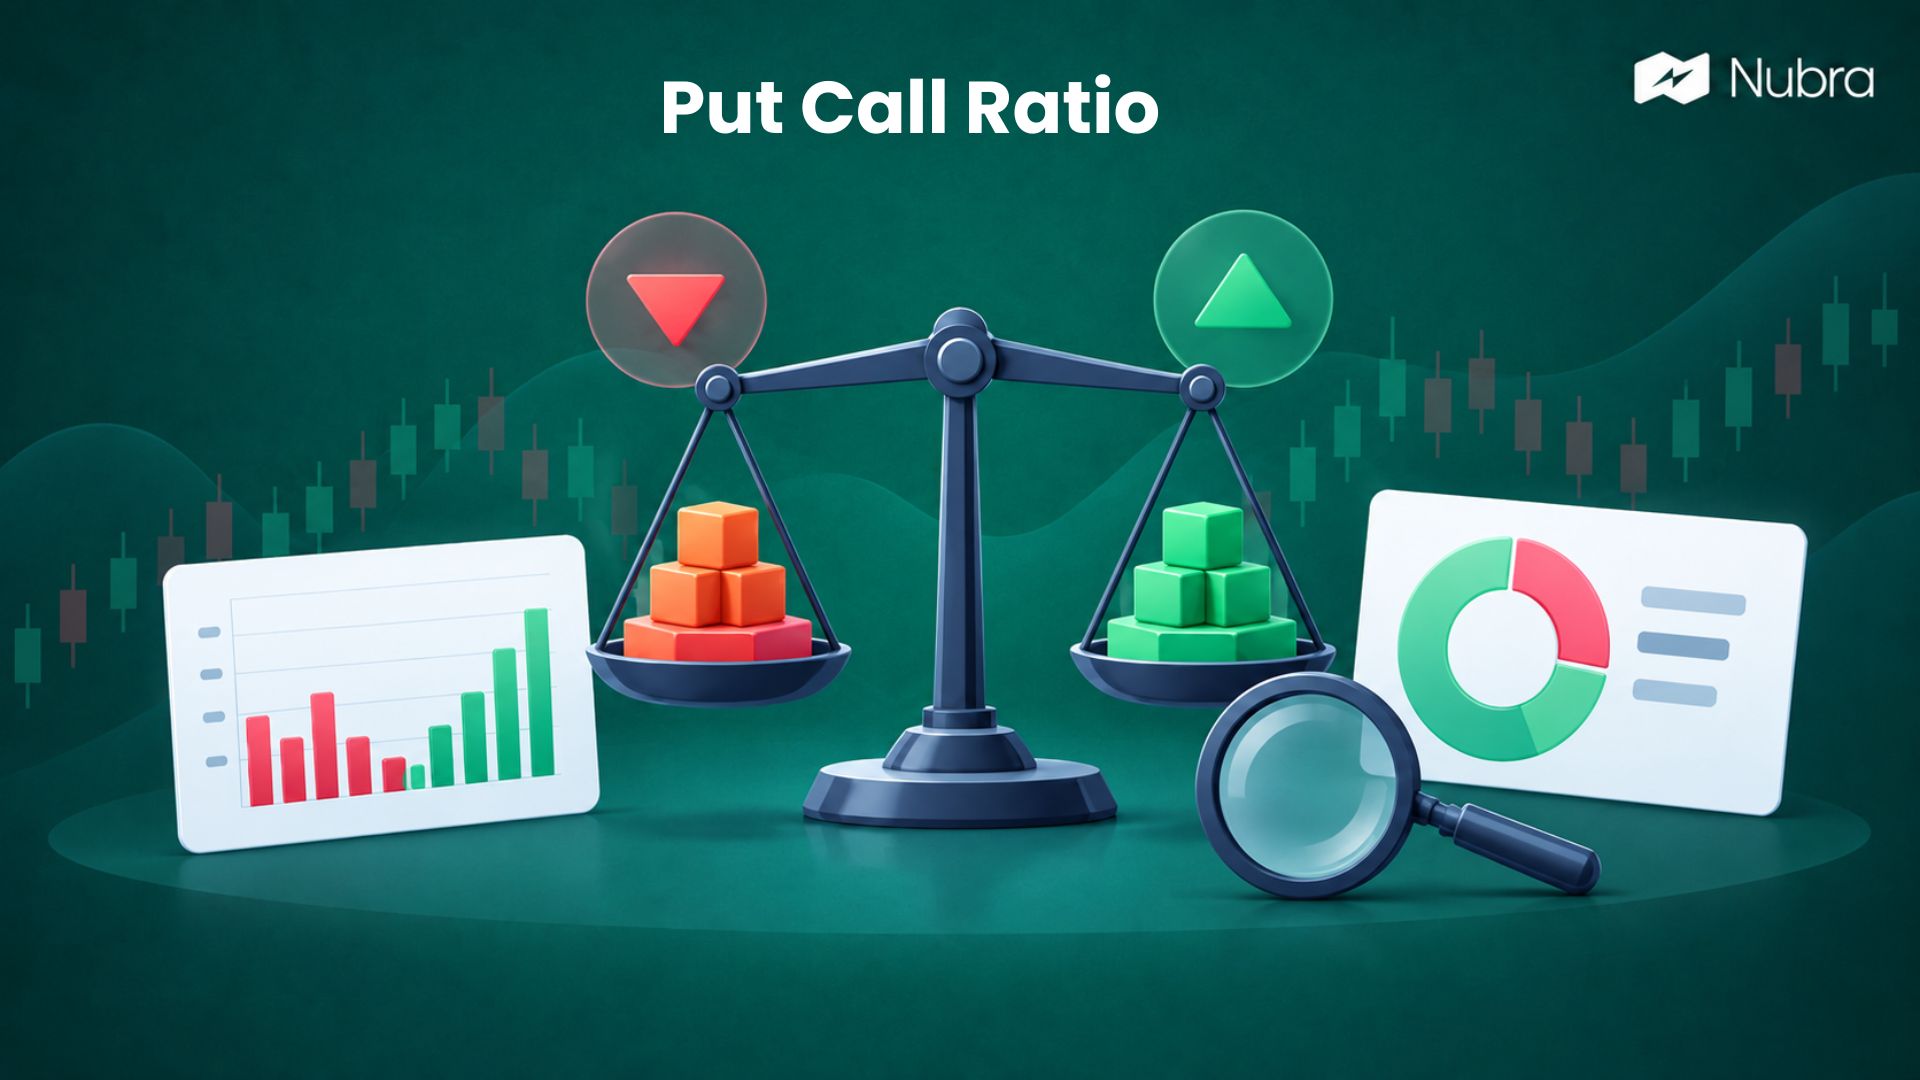
The put-call ratio (PCR) compares put options with call options using either open interest or trading volume. We use it to understand the balance of options activity, then compare that reading with price movement and market conditions.
A PCR above 1 means the selected put figure exceeds the call figure. Below 1, the call figure is larger. Neither reading tells us, on its own, where the market will move next.
What Does the PCR Ratio Mean?
PCR stands for put-call ratio. It summarises the relationship between puts and calls for a defined market, such as Nifty options for a selected expiry.
A call gives its buyer the right to buy the underlying at the strike price; a put gives the right to sell, subject to the contract’s terms. Both can form part of directional trades, hedges or multi-leg strategies.
We therefore start by checking what the PCR measures. Open interest (OI) counts outstanding contracts. Volume counts contracts traded during a period, including opening and closing trades. These inputs describe different things, so we keep them separate.
How Do We Calculate PCR?
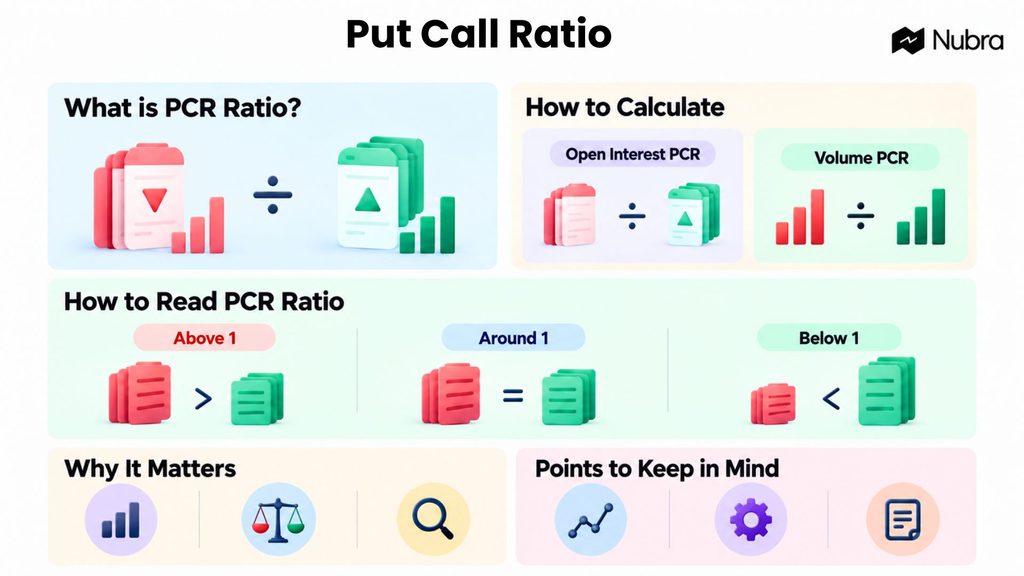
We divide the put figure by the matching call figure. The underlying, expiry scope, strike coverage and measurement time must be consistent.
Open Interest PCR Formula
PCR (OI) = Total put open interest ÷ Total call open interest
Suppose a selected Nifty expiry has 9,00,000 put contracts open and 6,00,000 call contracts open across the included strikes.
PCR (OI) = 9,00,000 ÷ 6,00,000 = 1.5
We have 1.5 open put contracts for every open call contract. This describes the balance of outstanding contracts; it does not establish that put buyers control the market.
Volume PCR Formula
PCR (Volume) = Total put trading volume ÷ Total call trading volume
For the same expiry, suppose 4,00,000 put contracts and 5,00,000 call contracts trade during the session.
PCR (Volume) = 4,00,000 ÷ 5,00,000 = 0.8
Put volume is 80% of call volume. The OI PCR of 1.5 and volume PCR of 0.8 can coexist because one measures open positions and the other measures trading activity.
We use matching units on both sides. PCR has no currency unit: an option premium of ₹100 is not an input to either formula. If the call figure is zero, the ratio is undefined.
How Do We Interpret High and Low PCR?
The first reading is mathematical:
- Above 1: put OI or volume exceeds the corresponding call figure.
- At 1: the two figures are equal.
- Below 1: the call figure exceeds the put figure.
The next question is what sits behind that balance. Every option contract has a buyer and a seller. A high PCR could include protective put buying, put writing or positions within a broader strategy. We cannot identify those motives from the ratio alone.
Similarly, a low PCR does not prove that traders are buying calls in anticipation of a rally. Call writing also contributes to call activity.
We compare the reading with its recent history for the same underlying and calculation scope. A PCR of 1.3 may look elevated in one period and ordinary in another. There is no universal “good PCR” or fixed level that confirms a market top or bottom.
What Does a Changing PCR Tell Us?
A rising OI PCR means put OI is increasing relative to call OI. That could happen because put OI rises, call OI falls, or both change at different rates. We check the underlying figures before interpreting the move.
For example, if put OI stays at 9,00,000 while call OI falls from 6,00,000 to 5,00,000, PCR rises from 1.5 to 1.8. No additional put OI was needed.
An unusually high or low reading may prompt a contrarian interpretation: we question whether positioning has become stretched. However, an extreme can persist. It does not tell us when a reversal will happen.
This is why we examine strike-level changes as well as totals. Our guide to OI spurts explains how sudden additions to open contracts need price and volume context.
How Do We Use PCR Alongside Other Data?
We can organise the analysis into four steps:
1. Check the inputs. Confirm whether we are reading OI PCR or volume PCR, and keep the underlying, expiry and strike range consistent.
2. Compare changes. Review the put and call totals separately rather than reacting only to the ratio.
3. Examine price and volatility. Check whether the underlying is trending or moving within a range, and whether premiums reflect changing volatility.
4. Assess the proposed position separately. Review payoff, potential loss, liquidity and position size; PCR does not answer these questions.
Our daily Nifty analysis guide brings price structure and options data into the same review. The guide to implied volatility in options explains why premium changes need more than a directional explanation.
On Nubra, we can use Nubra Option Chain to examine options data, Nubra Charts to study price movements, and Nubra Strategy Builder to explore payoff scenarios. These tools support analysis; they do not guarantee trading outcomes.
Near expiry, closing and rolling positions can change the figures quickly. Different providers may also include different expiries or strikes. We check those details before comparing PCR readings across screens.
FAQs
What Is the Full Form of PCR in Trading?
PCR stands for put-call ratio. We calculate it using put and call open interest or trading volume, depending on the data selected.
What Is a Good PCR Ratio?
There is no universal ideal value. We compare PCR with its recent range for the same underlying, expiry scope and calculation method.
Is a High PCR Bullish or Bearish?
Neither automatically. A high PCR shows a larger put figure, but the positions may reflect buying, writing or hedging. We need further context.
How Does OI PCR Differ From Volume PCR?
OI PCR compares outstanding contracts. Volume PCR compares contracts traded during a selected period. We can see different readings without either calculation being wrong.
Why Do PCR Values Differ Between Platforms?
Expiry selection, strike coverage, update times and the use of OI versus volume can differ. We check the calculation basis before comparing values.
Can PCR Predict the Next Market Move?
No. PCR alone cannot reliably establish direction or timing. We use it alongside price, volatility and risk analysis rather than as a buy or sell instruction.
Disclaimer: The information provided in this blog is for educational and informational purposes only and should not be construed as investment advice, financial advice, or a recommendation to buy, sell, or hold any securities or financial products. Investments in the securities market are subject to market risks. Please read all related documents carefully before investing. Readers should conduct their own research and consult a SEBI-registered investment adviser or other qualified financial professional before making any investment decisions. Past performance is not indicative of future results.