A pennant pattern is a short continuation pattern that forms after a sharp price move. We usually see it when price moves strongly, pauses in a tight triangular range, and then attempts to break out in the same direction. The first sharp move is called the flagpole. The pause that follows is the pennant. On…
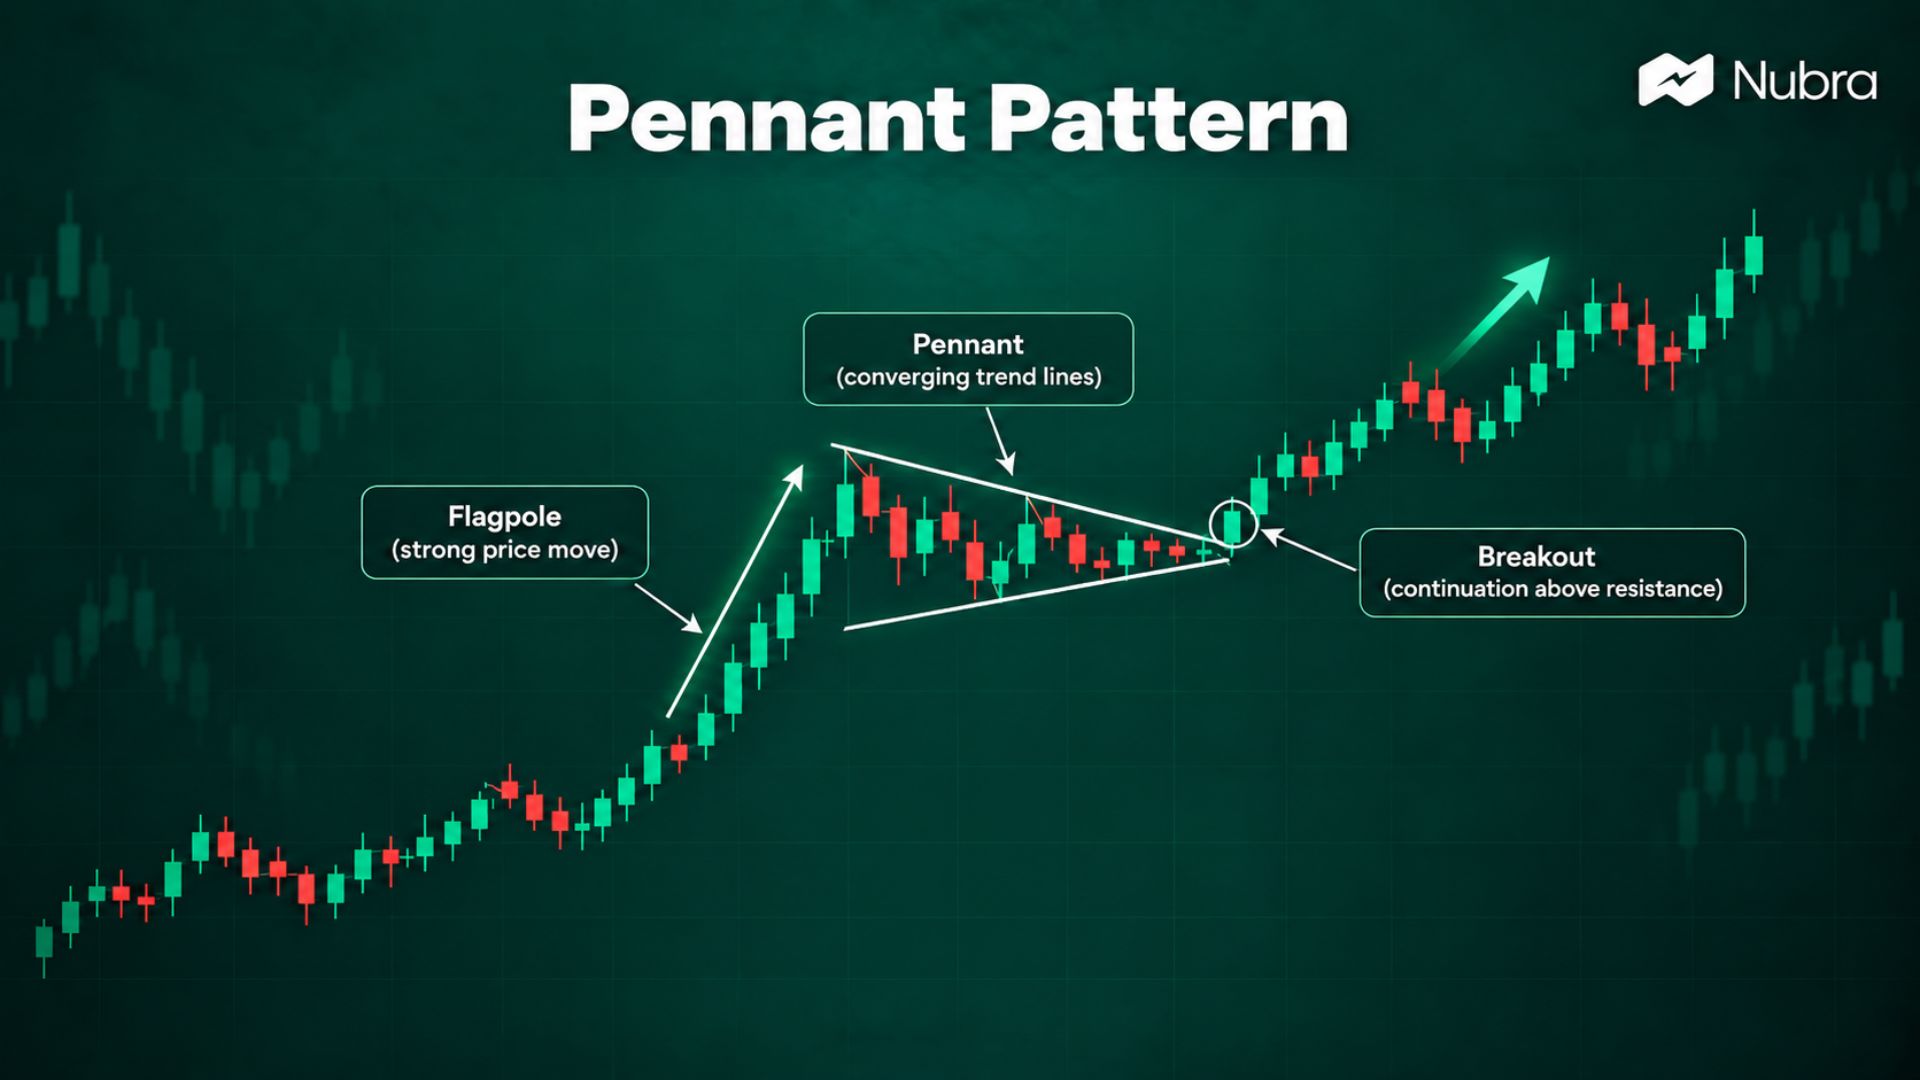
A pennant pattern is a short continuation pattern that forms after a sharp price move. We usually see it when price moves strongly, pauses in a tight triangular range, and then attempts to break out in the same direction.
The first sharp move is called the flagpole. The pause that follows is the pennant. On the chart, the pennant looks like a small triangle because the highs and lows start to contract. The pattern becomes useful only when the breakout is read with volume, trend context, and risk control. It should not be treated as a prediction or a guarantee.
For Indian stocks, indices, futures, or options, a pennant can help organise a continuation view. On Nubra Charts, we can start with price structure, then review volume and F&O context before deciding whether the setup is worth tracking.
What is a Pennant Pattern?
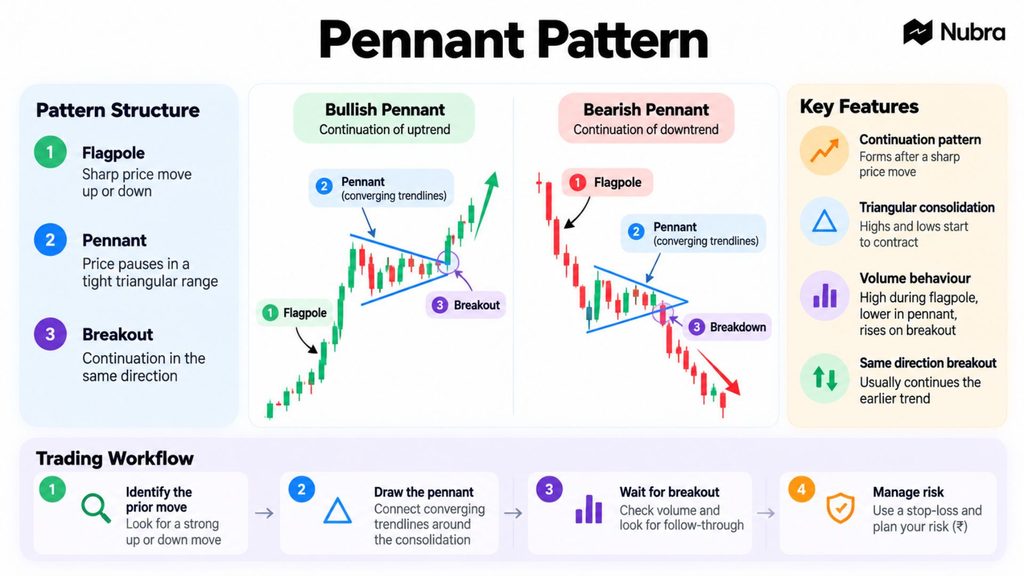
A pennant pattern forms in three parts. First, price makes a strong move upward or downward. This creates the flagpole. Then price pauses between two converging trend lines. Finally, price breaks out of the pennant, usually in the same direction as the first move.
After a fast move, some traders book profits, some wait for a better entry, and some test the opposite side. If the consolidation stays narrow and the original side regains control, the breakout can continue the earlier trend.
The pattern is more meaningful after a clear move. Without a sharp flagpole, the same triangle may simply be normal sideways movement.
Bullish Pennant Pattern
A bullish pennant appears after a strong upward move. Price then compresses into a small triangle. Traders usually watch the upper trend line. A breakout above that line, especially with stronger volume, suggests that buyers may be trying to continue the earlier uptrend.
We should also check where the pattern is forming. A bullish pennant near major resistance needs more caution than one that forms after a clean breakout with healthy participation. Momentum indicators such as RSI can add context, but they should not replace price confirmation. Nubra’s guide to the Relative Strength Index explains how RSI fits into technical analysis.
Bearish Pennant Pattern
A bearish pennant appears after a strong downward move. Price then contracts inside a small triangle. Traders watch the lower trend line. A breakdown below that line may suggest that sellers are trying to continue the downtrend.
The same caution applies here. A bearish pennant is not enough on its own. We need to check whether the earlier fall was decisive, whether volume supports the move, and whether the breakdown happens near support.
Key Features of a Pennant Pattern
A useful pennant pattern usually has a clear flagpole, compact consolidation, and converging trend lines. Volume often rises during the first move, falls during the pause, and expands again during the breakout. If price drifts for too long, the structure can lose its continuation quality.
Pennants also need clean risk definition. A trader may use the opposite side of the pennant or the most recent swing point to plan invalidation, but the exact level depends on timeframe, instrument, volatility, position size, and planned ₹ risk.
How Traders Read a Pennant Pattern
First, identify the prior move. A pennant should follow a strong price move, not a random range. Next, draw the two converging trend lines around the consolidation. Then wait for a breakout instead of assuming the pattern will resolve in the expected direction.
Once the breakout appears, volume and follow-through matter. A candle that quickly reverses back inside the pennant can become a failed breakout. That is why confirmation, stop placement, and reward-to-risk matter. Nubra’s guide to candlestick patterns explains why trend, location, volume, timeframe, and confirmation should be read together.
For options traders, the chart is only one layer. A continuation view can be compared with strike-level data on the Nubra Option Chain, while open interest and OI spurts can help show where positions are building. These inputs do not predict the breakout; they make the review more complete.
Pennant Pattern vs Flag Pattern
Pennants and flags are both continuation patterns. Both usually form after a sharp move and both show a pause before a possible continuation. The difference is the shape of the pause.
In a pennant, the consolidation narrows into a small triangle with converging trend lines. In a flag, the consolidation usually moves inside a small parallel channel.
The trading logic is similar: identify the flagpole, wait for the pause, and study the breakout. If the move is weak, volume is thin, or the breakout has no follow-through, the setup deserves caution whether we call it a flag or a pennant.
How Nubra Fits Into the Workflow
A pennant pattern is easier to study when chart structure, option data, and strategy planning are connected. On Nubra, traders can use Nubra Charts to review the flagpole, trend lines, breakout candle, and volume. They can use Nubra Option Chain to review strike-level OI, volume, IV, and Greeks where options data is relevant. They can also use the Nubra Strategy Builder to compare payoff behaviour before committing capital.
A pennant can frame a possible continuation, but trade quality still depends on liquidity, volatility, entry level, stop placement, position size, and broader market conditions. This page is for educational purposes and should not be treated as investment advice.
FAQs
Is a Pennant Pattern Bullish or Bearish?
A pennant pattern can be bullish or bearish. A bullish pennant forms after a sharp upward move. A bearish pennant forms after a sharp downward move.
How is a Pennant Different From a Flag Pattern?
A pennant has converging trend lines and looks like a small triangle. A flag has parallel trend lines and looks like a small channel. Both are usually studied as continuation patterns after a strong move.
Does a Pennant Pattern Guarantee a Breakout?
No. A pennant pattern does not guarantee a breakout or a profitable trade. It should be read with volume, trend context, liquidity, risk control, and broader market conditions.
How Long Does a Pennant Pattern Usually Last?
A pennant usually lasts for a short period, from a few candles to several trading sessions depending on the timeframe.
What Does Volume Indicate in a Pennant Pattern?
Volume often falls while the pennant is forming and may increase again when price breaks out of the pattern.
Can a Pennant Pattern Fail After a Breakout?
Yes, a pennant can fail if price breaks out but quickly reverses and moves back inside the consolidation range.
Disclaimer: The information provided in this blog is for educational and informational purposes only and should not be construed as investment advice, financial advice, or a recommendation to buy, sell, or hold any securities or financial products. Investments in the securities market are subject to market risks. Please read all related documents carefully before investing. Readers should conduct their own research and consult a SEBI-registered investment adviser or other qualified financial professional before making any investment decisions. Past performance is not indicative of future results.