Quantitative trading, or quant trading, is a way of making trading decisions with data, statistics, mathematical rules and computer models. Instead of relying only on instinct, chart reading or market commentary, we define a rule, test it on historical data, and use the result to decide whether the idea deserves further work. At its simplest,…
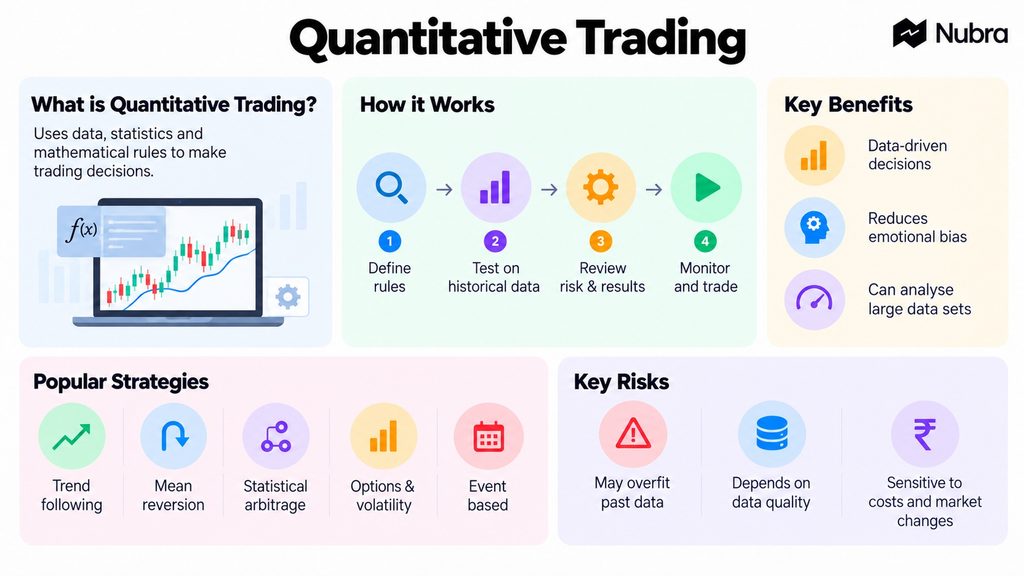
Quantitative trading, or quant trading, is a way of making trading decisions with data, statistics, mathematical rules and computer models. Instead of relying only on instinct, chart reading or market commentary, we define a rule, test it on historical data, and use the result to decide whether the idea deserves further work.
At its simplest, a quant strategy may say: enter when price breaks above a moving average with strong volume, reduce size when volatility rises, or skip the trade when the reward is too small after costs. At a more advanced level, quant trading can use options data, factor models, volatility signals, machine learning, execution algorithms and portfolio-level risk controls.
Quantitative trading is not magic. A model can organise decisions, reduce some emotional noise and test ideas more objectively, but it cannot guarantee profit. Markets change, liquidity shifts, costs matter, and a model that looked strong in the past can fail in live trading.
How Quantitative Trading Works
Most quant workflows start with a trading idea. The idea can come from price action, options data, open interest, volatility, fundamentals or a repeatable market observation. For example, we may want to test whether a stock tends to continue moving after a high-volume breakout, or whether a certain options setup behaves differently near weekly expiry.
The idea then needs clear rules. A broad view such as “buy strong stocks” is not enough. The model needs measurable conditions: what counts as strength, which timeframe is used, where the entry happens, when the trade exits, how much capital is used, and what happens if the market moves against the position.
After that, the rules are tested on historical data. This is called backtesting. A backtest checks how the strategy would have behaved in the past if the same rules were applied consistently. It is useful, but it can also mislead us if the test ignores brokerage, taxes, slippage, bad data, survivorship bias or over-optimised parameters.
The next step is risk review. We look at drawdown, win rate, average gain, average loss, risk-reward ratio, capital requirement and behaviour across different market conditions. A useful quant workflow does not ask only, “Did it make money?” It also asks, “How did it make money, and what could break it?”
Only after that should a strategy move into paper trading, live monitoring or automation. Even then, live results need continuous review because a model is a working hypothesis, not a permanent truth.
Quantitative Trading vs Algorithmic Trading
Quantitative trading and algorithmic trading are related, but they are not identical.
Quantitative trading is mainly about decision logic. It uses data and models to decide what to trade, when to trade and how much risk to take. Algorithmic trading is mainly about execution. It uses software to place, modify or manage orders according to pre-defined instructions.
In practice, the two often overlap. A quant strategy may generate a signal, and an algorithm may execute the order. But we can also use quantitative analysis manually, without automatic execution. Similarly, an execution algorithm can place orders efficiently without being a complete quant model.
For Indian traders, this distinction matters because every model-led workflow does not need full automation on day one. We can begin by using data to structure decisions, test ideas, compare setups and reduce discretionary guessing.
Common Quantitative Trading Strategies
Trend-following strategies try to capture sustained price movement. These models may use moving averages, breakouts, momentum indicators or volatility filters. They can struggle in choppy markets, where repeated false signals increase trading costs.
Mean-reversion strategies assume that prices sometimes move too far from a normal range and may revert. A model may compare price with moving averages, Bollinger Bands, volatility bands or statistical spreads. These strategies need strict risk controls because a move can keep extending longer than expected.
Statistical arbitrage and pairs trading look for relationships between securities. If two related instruments usually move together and then diverge, the model may trade the spread. This needs clean data, careful sizing and a clear exit rule when the relationship breaks down.
Options and volatility strategies use data such as implied volatility, Greeks, open interest, volume, expiry and payoff behaviour. Before placing an options trade, we would usually inspect liquidity and OI on the Nubra Option Chain, compare possible legs on the Nubra Strategy Builder, and study price behaviour on Nubra Charts. These tools support analysis; they do not predict the market with certainty.
Event-based strategies look at scheduled or unscheduled events such as results, policy announcements, expiry behaviour or major market news. The difficulty is that event reactions can be fast, uneven and sensitive to liquidity.
Example of a Quant Trading Workflow
Suppose we want to test a Nifty options idea around volatility. The rule may begin like this: when implied volatility rises sharply and price remains near a key range, compare a defined-risk options strategy instead of taking a naked directional trade.
To make that idea testable, we define each condition. How much should IV rise? Which expiry do we use? What OI or volume threshold makes the contract liquid enough? What is the maximum acceptable loss? What happens if the index moves outside the expected range?
A practical checklist may look like this:
- Check trend and volatility on charts.
- Review OI, volume, IV and Greeks on the option chain.
- Build the possible legs and payoff.
- Estimate risk, reward, breakeven and capital requirement.
- Include brokerage, taxes, spread and slippage.
- Paper trade or observe before risking real capital.
For options traders, Nubra’s guide to option strategy builders is a useful next step because it explains how multiple option legs can be combined and evaluated before a trade. If the model uses Greeks, the guide to Delta, Gamma, Theta, Vega and Rho can help translate option sensitivity into practical risk checks. For broader setup selection, 10 options strategies every investor should know gives examples of how payoff, expiry, volatility and risk differ across strategies.
Benefits of Quantitative Trading
The biggest benefit is structure. When rules are defined clearly, we can review decisions more honestly. We know why a trade was entered, why it was exited, and whether the result came from the strategy or from a one-off judgement.
Quant trading can also reduce emotional decision-making. Fear, greed and recency bias often affect live trades. A rules-based workflow does not remove risk, but it can reduce impulsive changes when the market moves quickly.
Another benefit is scale. A trader can track only a limited number of charts, strikes, timeframes and indicators. A model can scan more data, shortlist setups and highlight where deeper review is needed.
Backtesting also helps us reject weak ideas before risking capital. The key is to treat backtest results as evidence to examine, not as proof of future performance.
Risks and Limitations
Quantitative trading can fail when a model is built on poor assumptions. A strategy may be fitted too closely to past data and then perform badly in live markets. This is known as overfitting.
Data quality is another major issue. Missing candles, incorrect corporate actions, stale option-chain data, bad tick data or survivorship bias can distort results. In options, even a small error in IV, spread, expiry or lot size can change the practical outcome.
Costs can also damage performance. A strategy that looks profitable before brokerage, taxes, bid-ask spread and slippage may become unattractive after real trading costs. This is especially important for frequent trading and multi-leg options strategies.
Finally, market conditions change. A model built during a trending market may struggle in a range-bound market. A volatility strategy may behave differently around expiry, events or sudden liquidity shocks. We should keep reviewing live performance instead of assuming that a model will keep working forever.
Final Thoughts
Quantitative trading is best understood as a disciplined way to convert trading ideas into rules, test those rules, and manage them with evidence. It can help us move from “this looks good” to “this is the condition, this is the risk, this is the historical behaviour, and this is when the idea is invalid.”
The strongest use of quant trading is not blind automation. It is better decision-making. When we combine charts, option-chain data, strategy builders, backtesting and risk controls, we give ourselves a more structured way to evaluate trades before capital is at risk.
This article is for educational purposes only and should not be treated as investment advice. Trading involves market risk, and quantitative models or strategy examples do not guarantee returns.
FAQs
What is Quantitative Trading in Simple Terms?
Quantitative trading is a data-led trading approach where rules, statistics and models are used to decide what to trade, when to trade and how much risk to take.
Is Quantitative Trading the Same as Algorithmic Trading?
No. Quantitative trading focuses on model-based decision-making, while algorithmic trading focuses on automated order execution. Many quant strategies use algorithms, but the terms are not identical.
Can Retail Traders use Quantitative Trading?
Yes, retail traders can use quant principles such as rule-based entries, backtesting, position sizing, risk checks and paper trading. Full automation requires more technical skill, infrastructure and compliance awareness.
What is the Biggest Risk in Quantitative Trading?
One of the biggest risks is trusting a backtest too much. Poor data, overfitting, ignored trading costs and changing market conditions can make live results very different from historical results.
Disclaimer: The information provided in this blog is for educational and informational purposes only and should not be construed as investment advice, financial advice, or a recommendation to buy, sell, or hold any securities or financial products. Investments in the securities market are subject to market risks. Please read all related documents carefully before investing. Readers should conduct their own research and consult a SEBI-registered investment adviser or other qualified financial professional before making any investment decisions. Past performance is not indicative of future results.