Moving Average Convergence Divergence, commonly called MACD, is a technical indicator that helps traders study trend direction and momentum. It compares two exponential moving averages of price, then turns that relationship into a line, a signal line, and a histogram. In simple terms, MACD helps us answer three practical questions on a chart: is momentum…
Moving Average Convergence Divergence, commonly called MACD, is a technical indicator that helps traders study trend direction and momentum. It compares two exponential moving averages of price, then turns that relationship into a line, a signal line, and a histogram.
In simple terms, MACD helps us answer three practical questions on a chart: is momentum moving with the trend, is momentum slowing, and is there a possible shift in direction? It does not predict the market with certainty. It reads past price data and gives a structured way to study momentum, so every signal needs context.
For Indian traders looking at Nifty, Bank Nifty, Sensex stocks, stock futures, or options, MACD can be useful because it keeps the focus on price behaviour instead of noise from every candle. It is stronger when read with price structure, volume, support and resistance, open interest, and risk controls.
What Is MACD?
MACD is a trend-following momentum indicator based on the relationship between a shorter-period exponential moving average and a longer-period exponential moving average.
The standard MACD setting is 12, 26, 9:
- 12-period EMA: the faster moving average
- 26-period EMA: the slower moving average
- 9-period EMA of the MACD line: the signal line
The word convergence means the two moving averages are moving closer together. Divergence means they are moving apart. When the distance between the averages expands, momentum is increasing in that direction. When the distance shrinks, momentum is cooling.
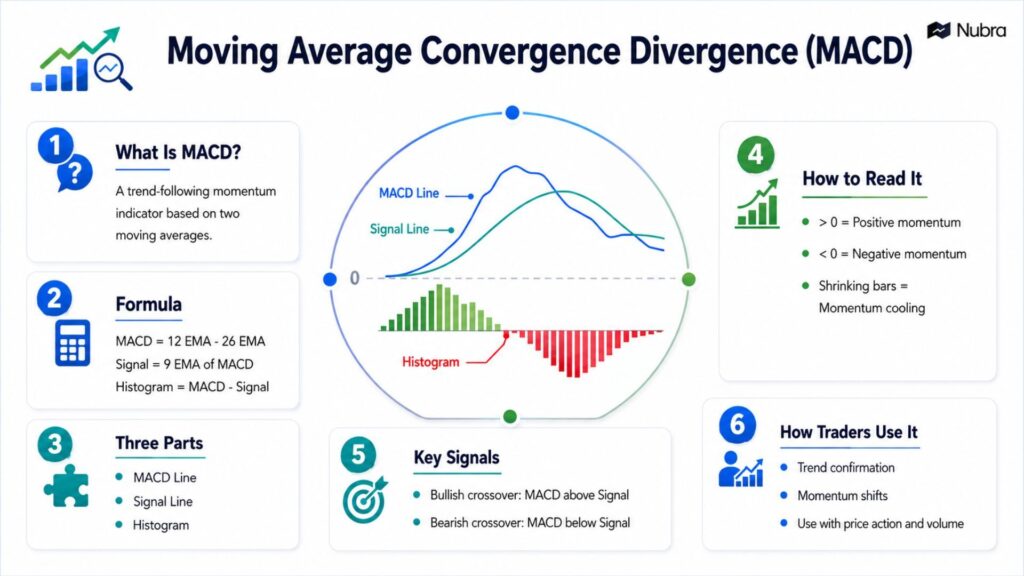
The Three Main Parts Of MACD
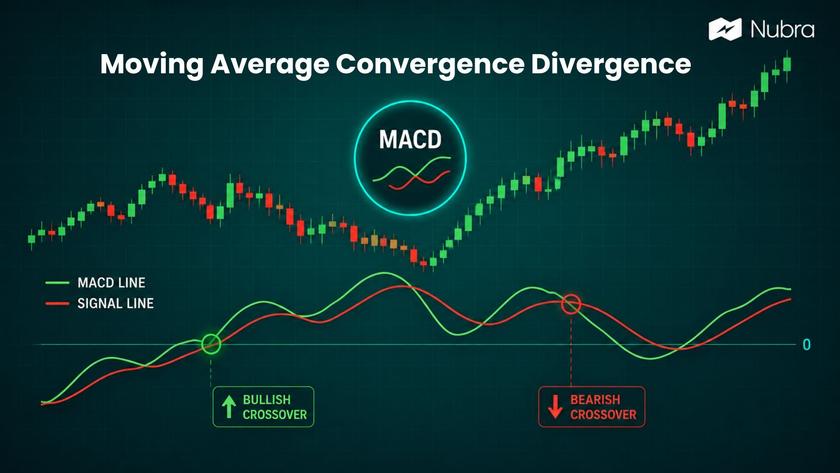
The MACD line is the difference between the 12-period EMA and the 26-period EMA. It moves faster than the signal line because it reacts directly to the relationship between the two EMAs.
The signal line is usually a 9-period EMA of the MACD line. It smooths the MACD line and is used to study crossovers.
The histogram shows the difference between the MACD line and the signal line. When the MACD line is above the signal line, the histogram is above zero. When the MACD line is below the signal line, the histogram is below zero.
The zero line is also important. When MACD is above zero, the faster EMA is above the slower EMA. When MACD is below zero, the faster EMA is below the slower EMA.
MACD Formula
The standard MACD formula is:
MACD line = 12-period EMA – 26-period EMA
Signal line = 9-period EMA of the MACD line
Histogram = MACD line – Signal line
An exponential moving average gives more weight to recent prices than older prices. That is why MACD can respond faster than a simple moving-average comparison. Still, it is based on historical price data, so it is lagging.
The default 12, 26, 9 setting is widely used, especially on daily charts. Shorter settings can make MACD more sensitive, but they can also create more noise. Longer settings can smooth the reading, but they may react later.
How To Read MACD
The easiest way to read MACD is to move from trend context to signal context.
First, look at the price trend. Is price making higher highs and higher lows, lower highs and lower lows, or moving sideways? MACD signals carry more weight when they align with the larger price structure.
Second, look at the MACD line relative to the signal line. A crossover can show that momentum is changing, but it should not be treated as an automatic trade.
Third, look at the zero line and histogram. MACD above zero generally suggests positive momentum compared with the longer EMA. Expanding histogram bars show momentum widening; shrinking bars show momentum cooling.
This sequence keeps the reading grounded. A crossover in a sideways market can fail quickly, while the same crossover after a pullback within a clear trend can carry more meaning.
Signal-Line Crossovers
A bullish crossover happens when the MACD line moves above the signal line. It suggests that short-term momentum is improving relative to the smoothed signal line.
A bearish crossover happens when the MACD line moves below the signal line. It suggests that short-term momentum is weakening relative to the signal line.
Crossovers are easy to spot, which is why many traders start with them. The challenge is that they can appear frequently in choppy markets. If Nifty is moving inside a narrow range, MACD may cross up and down without a clean trend. In that situation, a trader usually needs confirmation from price breakout, volume, broader market direction, or another indicator.
In a trending market, crossovers can be more useful as continuation signals. For example, if a stock is in an uptrend and pulls back toward support, a bullish MACD crossover may show that momentum is returning. That still does not guarantee continuation, but it gives a more structured setup than reading the crossover alone.
Zero-Line Movement
The zero line shows whether the 12-period EMA is above or below the 26-period EMA.
When MACD crosses above zero, it means the faster EMA has moved above the slower EMA. That often reflects a shift toward positive momentum. When MACD crosses below zero, the faster EMA has moved below the slower EMA, which often reflects negative momentum.
Zero-line signals are usually slower than signal-line crossovers, but they can help filter weak setups. A bullish crossover below zero may be an early sign of recovery, while a bullish crossover above zero may show momentum improving in an already positive structure. The trade-off is timing: waiting for confirmation can reduce some noise, but it may also mean entering later.
MACD Histogram
The histogram is a quick visual view of the distance between the MACD line and the signal line.
When histogram bars grow above zero, bullish momentum is expanding. When bars shrink above zero, bullish momentum is slowing. When bars grow below zero, bearish momentum is expanding. When bars shrink below zero, bearish momentum is cooling.
Many traders watch the histogram because it can show momentum slowing before the MACD line crosses the signal line. Smaller bars during a price rise do not confirm a reversal, but they tell us to look more closely at price action, volume, and key levels.
In options trading, this can help with timing analysis, but it should be handled carefully because expiry, implied volatility, and strike selection can change the result of a position.
Bullish And Bearish Divergence
Divergence happens when price and MACD stop confirming each other.
A bullish divergence appears when price makes a lower low, but MACD makes a higher low. This may suggest that downside momentum is weakening.
A bearish divergence appears when price makes a higher high, but MACD makes a lower high. This may suggest that upside momentum is weakening.
Divergence is useful because it highlights a possible mismatch between price and momentum. But it is also one of the most misread MACD signals. A strong trend can keep moving even while divergence appears. Bearish divergence can show slowing momentum, not an immediate reversal; bullish divergence can appear before price actually stabilizes.
The better approach is to combine divergence with structure. If bearish divergence appears near resistance and price also breaks a short-term support, the signal becomes more relevant. If bullish divergence appears near a demand zone and price reclaims a key level, the setup is easier to evaluate.
MACD Vs RSI
MACD and RSI are both momentum indicators, but they answer different questions. MACD studies the relationship between moving averages, while RSI studies the speed and size of recent price moves.
RSI is usually shown on a 0 to 100 scale, with common reference zones around 70 and 30. MACD does not have fixed overbought or oversold levels, so we compare it with the same instrument’s recent behaviour instead of using one fixed threshold.
How Traders Can Use MACD Responsibly
A simple workflow can look like this:
- Identify the broader trend on a higher timeframe.
- Mark support, resistance, and major price zones.
- Check whether MACD supports the direction of the trend.
- Use crossovers, zero-line movement, or histogram changes as timing inputs.
- Confirm with volume, market breadth, open interest, or another relevant input.
- Define risk before entering any trade.
For F&O traders, this workflow can be extended with option-chain data. If Bank Nifty is breaking above resistance and MACD momentum is improving, a trader may still want to check OI build-up, expiry context, volatility, and liquidity before evaluating an options strategy.
Limitations Of MACD
It is lagging because it is calculated from historical price data. By the time a crossover appears, part of the move may already have happened.
It can generate false signals in sideways markets. When price is range-bound, MACD may keep crossing without a sustained trend.
It does not measure valuation, news, earnings, macro events, liquidity, or option-specific factors. A MACD signal on the underlying chart does not automatically translate into a suitable options trade.
It can behave differently across timeframes. A bullish MACD on a 5-minute chart may exist inside a bearish daily trend. Timeframe alignment matters. The practical reading is simple: MACD can help structure momentum analysis, but it cannot remove market risk.
Using MACD In A Broader Trading Workflow
MACD is particularly relevant on a Nubra educational page when it is linked to active trading activities such as chart analysis, F&O analysis, option chain interpretation and risk planning. A trader reviewing a Nifty chart may use MACD to assess whether momentum is strengthening after a pullback. They may then examine option chain open interest, key strike prices around expiry, and consider whether the risk-to-reward profile of a particular strategy is acceptable.
A trader building a multi-leg options strategy may use MACD only as one input for directional view. Payoff, Greeks, volatility, expiry, liquidity, and position sizing still matter. We use MACD to make momentum easier to read, then use broader market context to decide whether the reading is actionable.
FAQs
What does MACD stand for?
MACD stands for Moving Average Convergence Divergence. It measures the relationship between a shorter-period EMA and a longer-period EMA to help traders study trend momentum.
What is the standard MACD setting?
The standard MACD setting is 12, 26, 9. The MACD line is the 12-period EMA minus the 26-period EMA, and the signal line is usually the 9-period EMA of the MACD line.
Is MACD a leading or lagging indicator?
MACD is mainly a lagging indicator because it is based on historical price data. The histogram may show momentum changes earlier than a line crossover, but it still needs confirmation.
What Does a MACD Crossover Mean?
A bullish crossover may indicate improving momentum, while a bearish crossover may indicate weakening momentum.
How Is MACD Calculated?
MACD is calculated by subtracting the 26-period EMA from the 12-period EMA. The signal line is the 9-period EMA of MACD.
What Does the MACD Histogram Show?
The histogram shows the difference between the MACD line and signal line, helping traders identify changes in momentum.
Can MACD Be Used for Intraday Trading?
Yes. MACD can be used for intraday analysis, but shorter timeframes may produce more noise and false signals.
Is MACD Useful for Options Trading?
Yes, MACD can provide a directional input, but options trading also depends on volatility, expiry, strike selection, Greeks, and liquidity.
Disclaimer: The information provided in this blog is for educational and informational purposes only and should not be construed as investment advice, financial advice, or a recommendation to buy, sell, or hold any securities or financial products. Investments in the securities market are subject to market risks. Please read all related documents carefully before investing. Readers should conduct their own research and consult a SEBI-registered investment adviser or other qualified financial professional before making any investment decisions. Past performance is not indicative of future results.