Bullish candlestick patterns help traders read where buying interest may be returning to a chart. They are useful because they turn price action into a visual story: sellers tried to push the market lower, buyers responded, and the candle closed in a way that suggests the balance may be shifting. That shift is important, but…
Bullish candlestick patterns help traders read where buying interest may be returning to a chart. They are useful because they turn price action into a visual story: sellers tried to push the market lower, buyers responded, and the candle closed in a way that suggests the balance may be shifting.
That shift is important, but it is not a trade by itself. A bullish candle at a random level can be noise. A bullish pattern after a clear decline, near a support zone, with stronger volume and follow-through is more useful. The pattern is the first clue; context decides whether it deserves attention.
For active traders in Nifty, Bank Nifty, stock, or F&O workflows, bullish candlestick patterns are best used as part of a checklist. The chart should answer a few practical questions before any trade is planned: Where is the pattern forming? What trend came before it? Is the broader market supporting the move? Is volume improving? Where would the setup be invalidated?
This guide explains nine commonly used bullish candlestick patterns and how to read them with that practical lens.
What Is a Bullish Candlestick Pattern?
A bullish candlestick pattern is a candle or group of candles that suggests buyers are gaining strength. It may appear after a downtrend, where traders watch for a possible reversal, or during an uptrend, where traders watch for continuation after a pause.
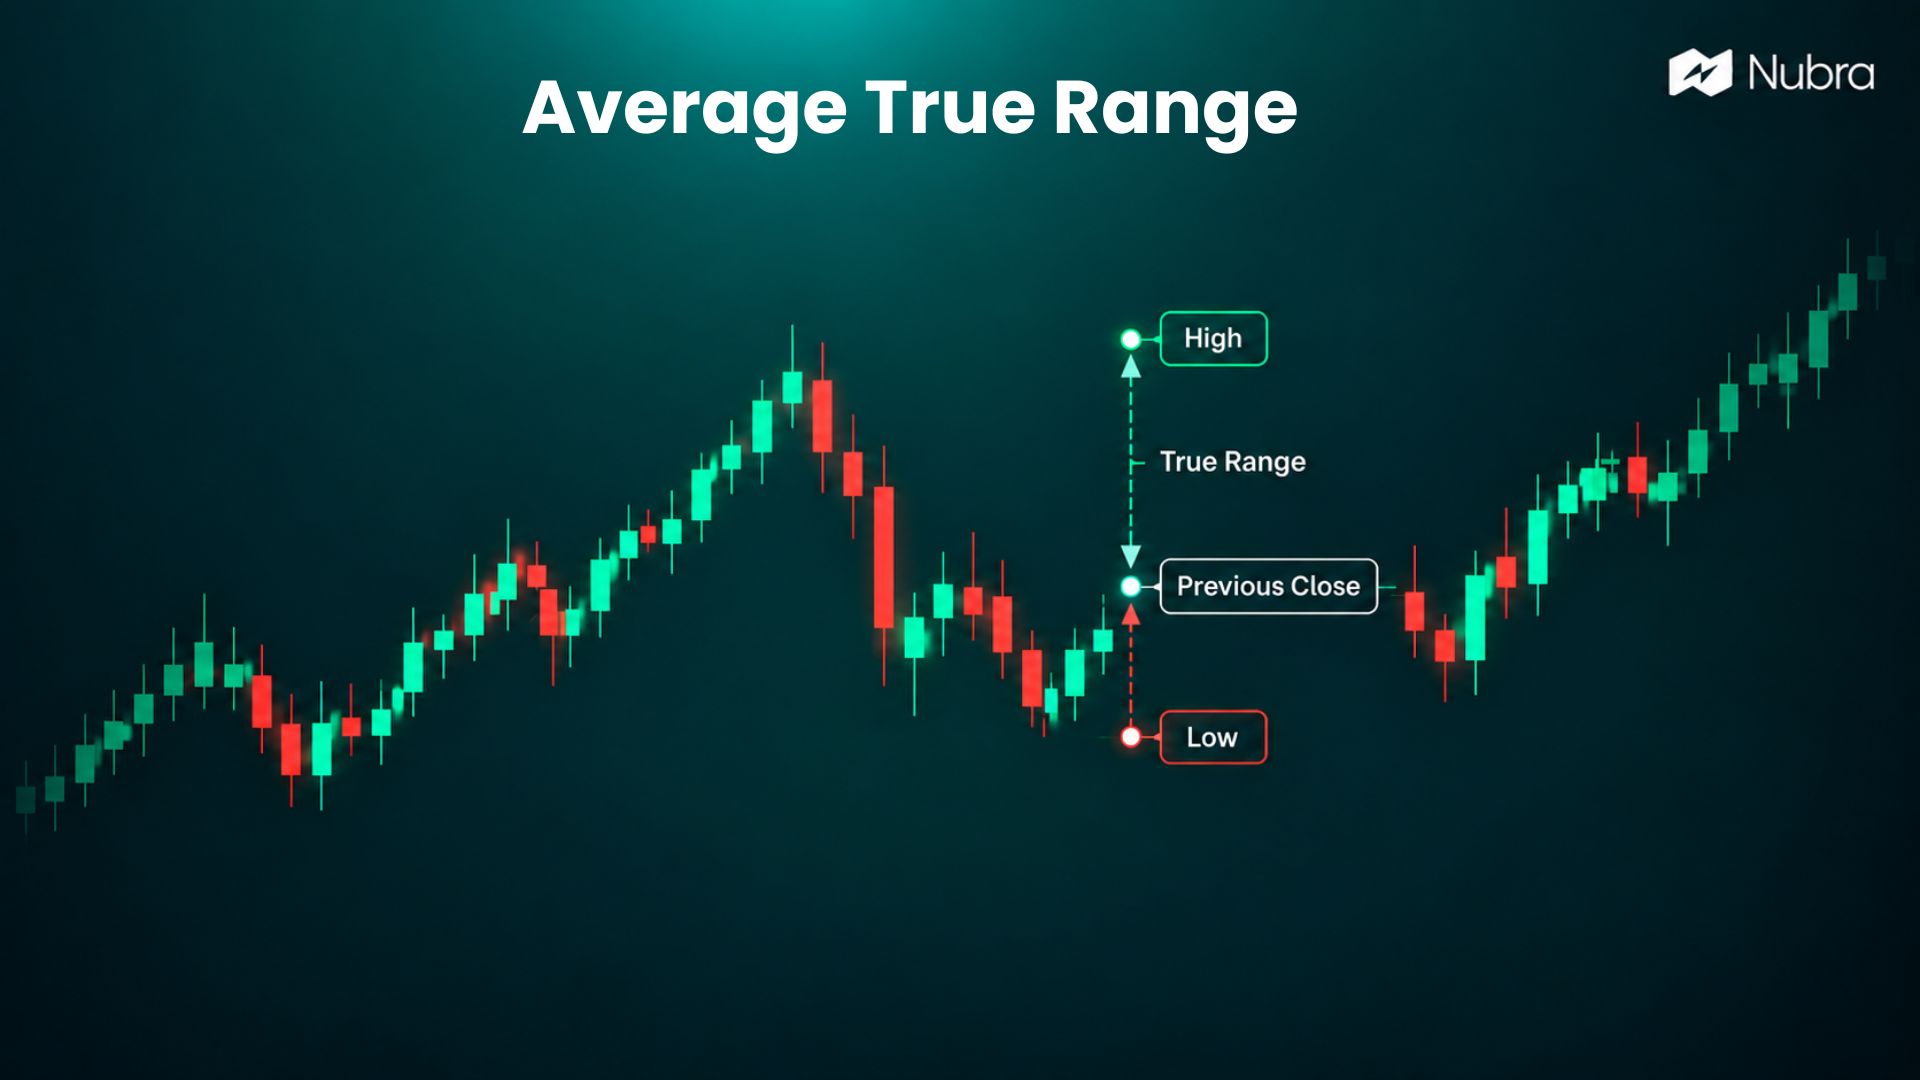
Every candlestick is built from four prices:
- Open: where the price started during the chosen timeframe
- High: the highest traded price during that timeframe
- Low: the lowest traded price during that timeframe
- Close: where the price ended during that timeframe
The candle body shows the distance between open and close. The wick, also called the shadow, shows how far price moved beyond the body. A strong body often signals momentum. A long lower wick often signals rejection of lower prices. A small body often signals hesitation or reduced conviction.
For example, if Bank Nifty falls during a 15-minute candle but closes near the high of that candle, the lower wick shows that sellers pushed price down but could not hold control. That does not guarantee a reversal. It simply shows that buyers defended the lower area during that candle, which makes the next candle and the surrounding level worth watching.
Bullish Reversal vs Bullish Continuation Patterns
Bullish candlestick patterns usually fall into two categories.
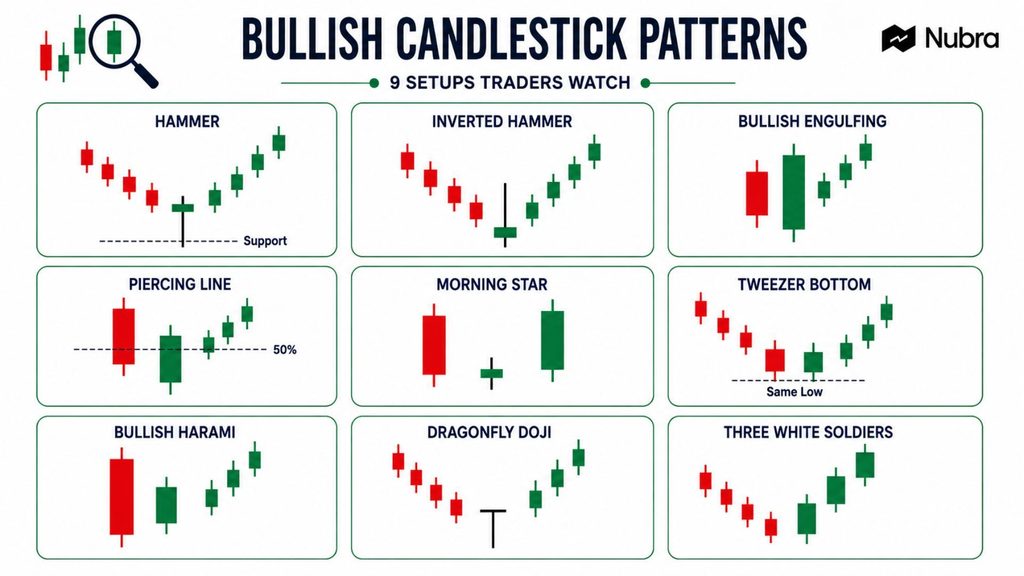
Bullish reversal patterns appear after a decline and suggest that selling pressure may be weakening. Hammer, inverted hammer, bullish engulfing, piercing line, morning star, tweezer bottom, bullish harami, and dragonfly doji are often read this way.
Bullish continuation patterns appear during an existing uptrend and suggest that the trend may be pausing before continuing. Three white soldiers and rising three methods are common examples. Some patterns, such as bullish engulfing, can also support continuation if they appear during a pullback inside a larger uptrend.
This distinction matters because a bullish pattern should not be read in isolation. A hammer after a downtrend near support can indicate rejection. The same hammer in the middle of a choppy range may not offer much information. A strong bullish candle after a long rally can show strength, but it can also leave the trader entering late with a wide stop-loss.
How to Confirm Bullish Candlestick Patterns
Before using any bullish pattern, check the chart around it. A simple confirmation process can reduce the risk of reading too much into one candle.
- Check the prior trend. A reversal pattern needs a visible decline before it. Without that, there may be nothing meaningful to reverse.
- Check the location. Bullish patterns are more relevant near support, demand zones, moving averages, VWAP, previous breakout zones, or high-volume areas.
- Check volume. Higher participation can make a bullish candle more meaningful, especially for engulfing candles, hammers, and breakouts.
- Check follow-through. A bullish close after the pattern often matters more than the pattern name itself.
- Check invalidation. Before planning the trade, know the price level where the setup is proven wrong.
This is where many traders get trapped. The pattern may be technically correct, but the risk-reward can still be poor. A very large bullish engulfing candle, for instance, may confirm buyer strength, but it can also make the stop-loss too wide. In that case, waiting for a pullback or a cleaner setup may be more disciplined than entering immediately.
9 Bullish Candlestick Patterns Traders Watch
1. Bullish Engulfing Pattern
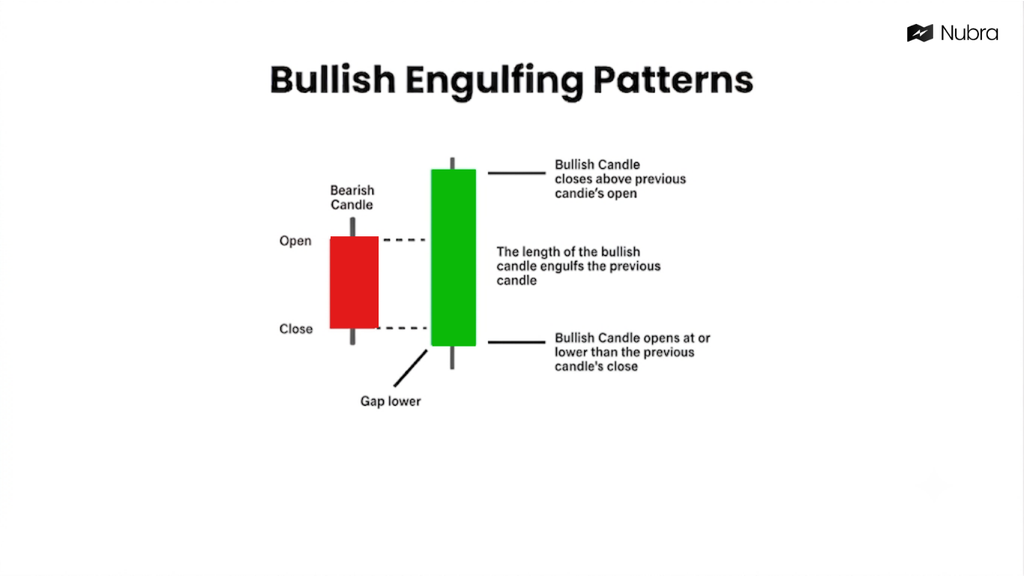
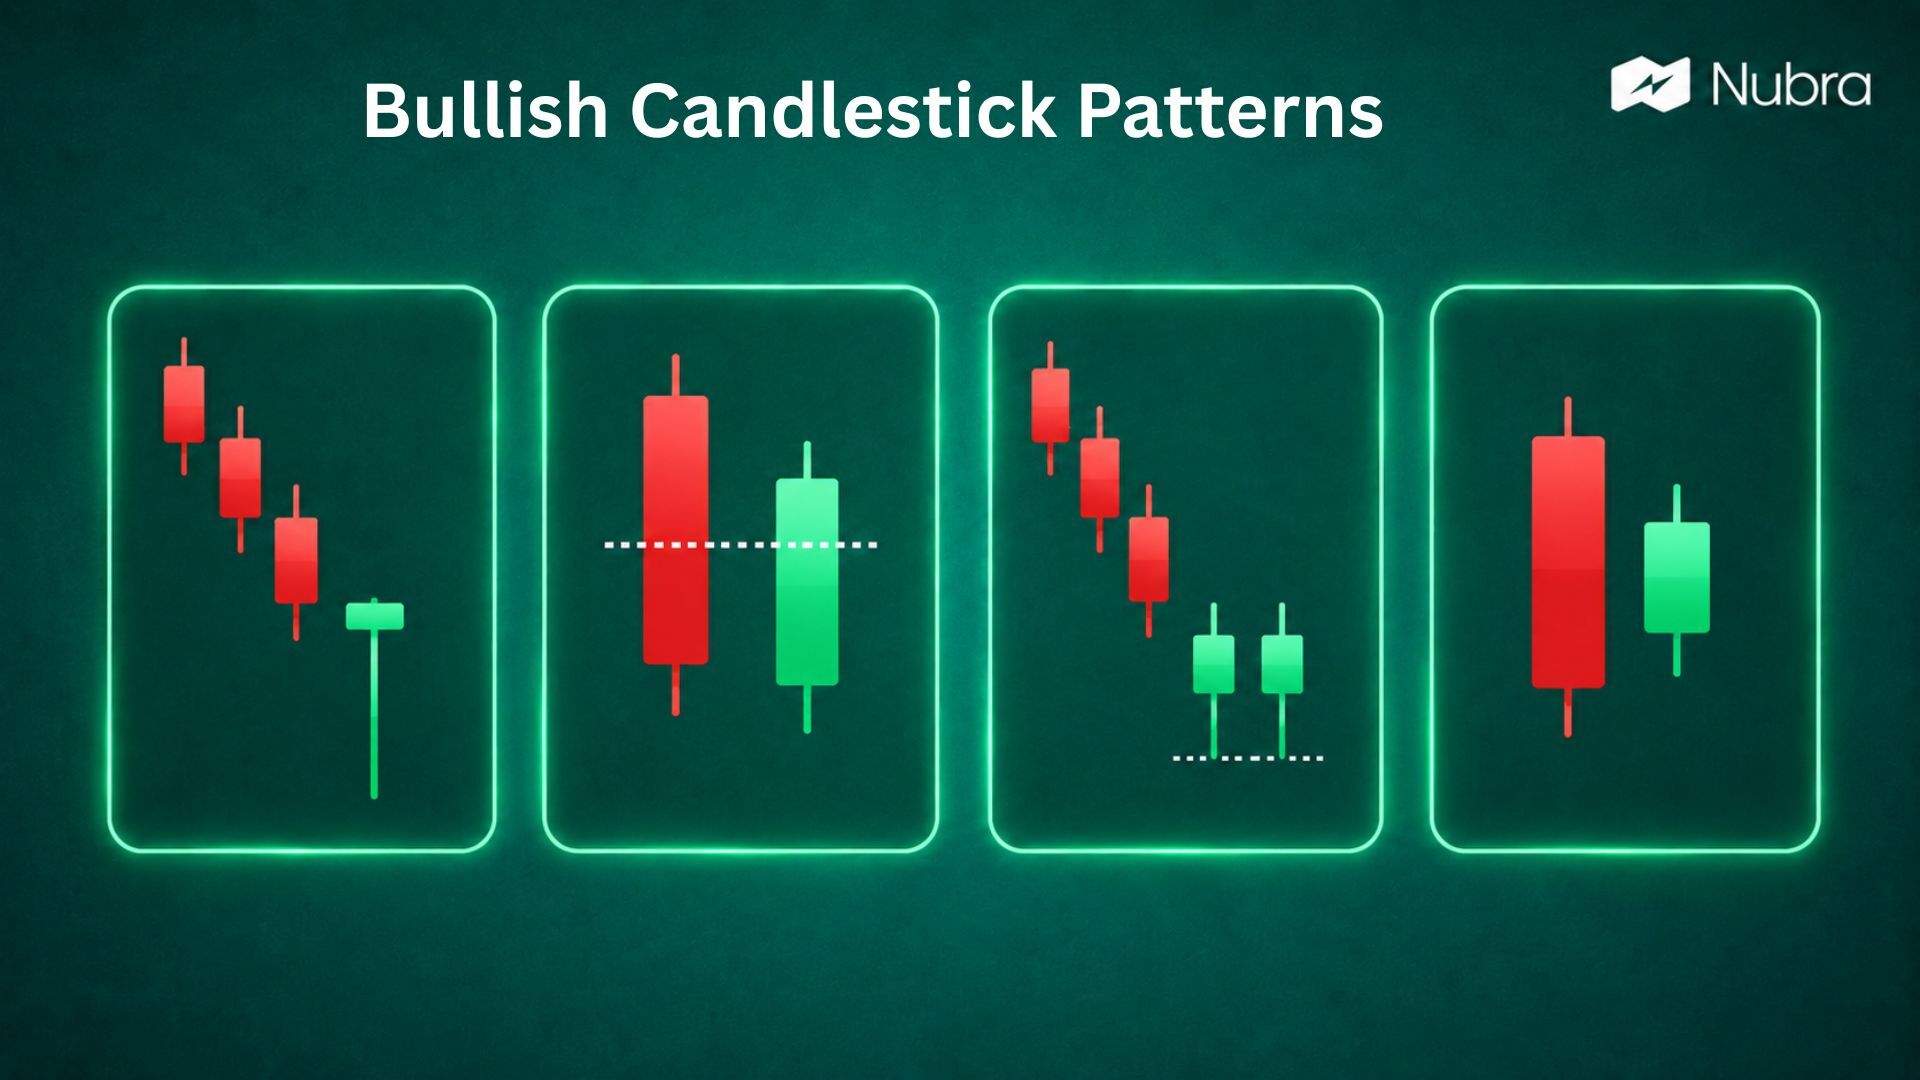
A bullish engulfing pattern forms when a bullish candle covers the body of the previous bearish candle. It usually appears after a decline or during a pullback and suggests that buyers have overpowered sellers during the latest candle.
The pattern becomes stronger when the second candle has a clear body, closes near its high, and appears near an important support area. Volume can add conviction because it suggests that more participation backed the shift.
A practical reading is simple: sellers controlled the previous candle, but buyers took control with enough strength to erase that candle’s body. For an Indian market example, if a liquid stock has been falling into a known support zone and then prints a bullish engulfing candle with higher volume, the setup deserves attention. Still, the next question should be where the trade is invalidated. If the candle is too large and the stop has to sit far below the low, the pattern may look strong but trade poorly.
2. Hammer
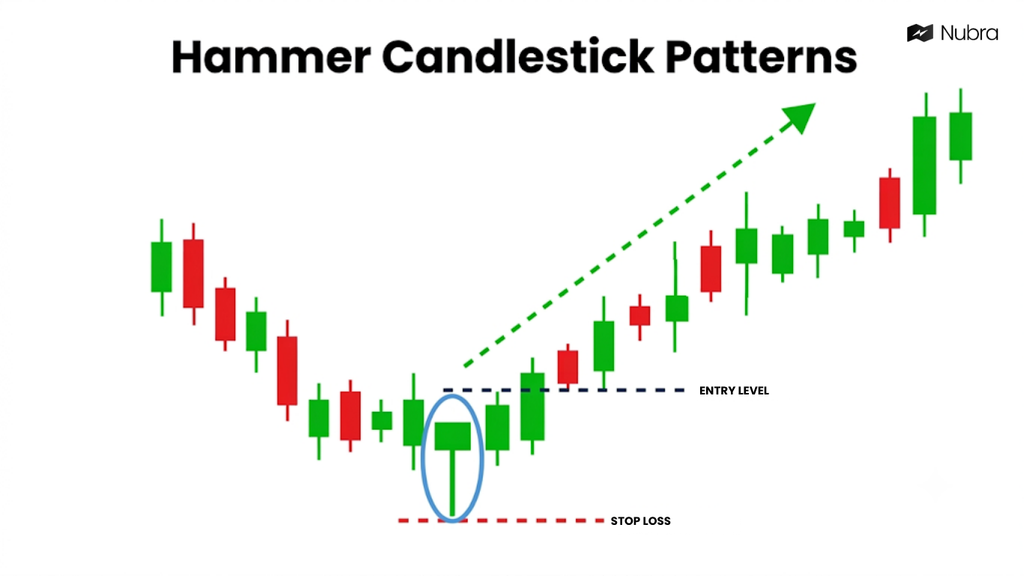
A hammer is a single-candle bullish reversal pattern with a small body near the top of the candle and a long lower wick. It usually appears after a decline. The long lower wick shows that sellers pushed the price down, but buyers brought it back before the close.
The hammer is more useful when it forms near a support level, demand zone, moving average, or previous swing low. The colour of the candle can matter less than the structure, although a bullish close can add confidence.
The key is not just the shape. The candle should show rejection at a meaningful area. If Nifty falls into a prior support zone and forms a hammer on a higher timeframe, traders often watch whether the next candle can close above the hammer’s high. If it cannot, the rejection may not have enough follow-through.
3. Inverted Hammer
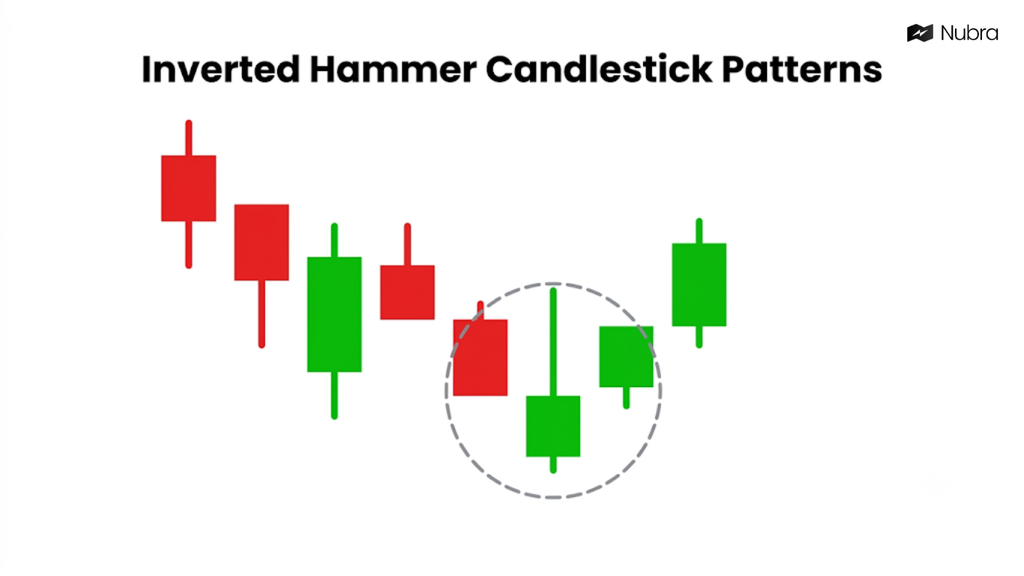
An inverted hammer appears after a decline and has a small body near the lower end of the candle with a long upper wick. At first glance, the long upper wick can look bearish because price failed to hold the high. In a downtrend, however, it can show that buyers are beginning to test supply.
This pattern needs confirmation more than many traders expect. The inverted hammer tells you buyers attempted to push price higher. It does not prove that buyers are already in control. A stronger signal appears when the next candle closes higher or breaks above the inverted hammer’s high.
In practice, this setup is usually more useful to evaluate when the broader structure supports it. If Bank Nifty has sold off into a support zone and an inverted hammer forms after several weak candles, the next bullish close becomes the important evidence. Without that follow-through, sellers may still be controlling the chart.
4. Piercing Line
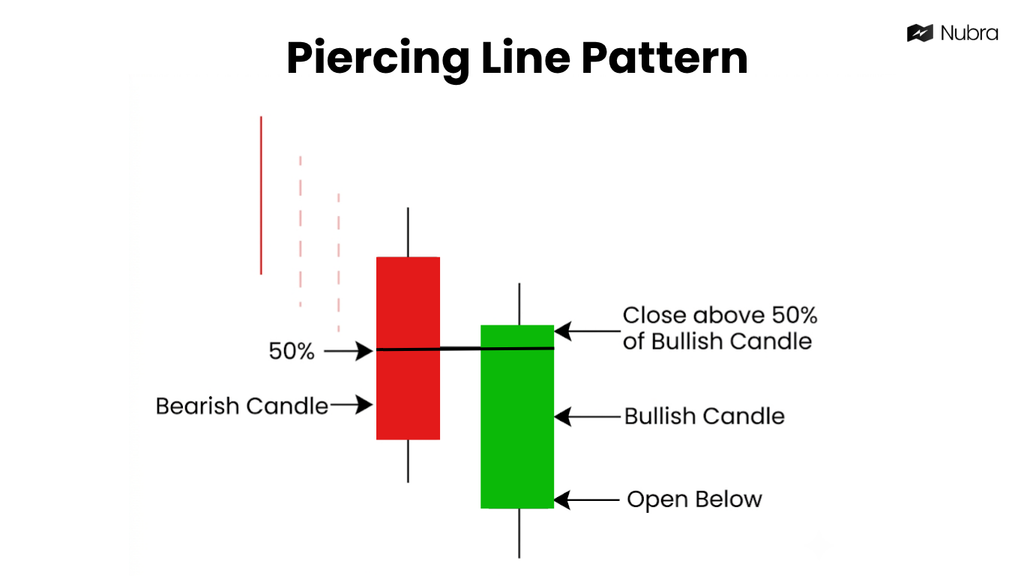
The piercing line is a two-candle bullish reversal pattern. The first candle is bearish. The second candle opens lower, then recovers and closes above the midpoint of the first candle’s body.
The psychology is straightforward. Sellers begin with control, often continuing the previous decline. Buyers then step in strongly enough to recover a meaningful part of the prior candle. The deeper the second candle closes into the first candle’s body, the stronger the signal tends to look.
This pattern is usually more meaningful when both candles have real bodies rather than tiny, indecisive candles. A piercing line near support can suggest that selling pressure is slowing, but traders still need confirmation. If the next candle fails and price breaks below the pattern low, the bullish read is invalidated.
5. Morning Star
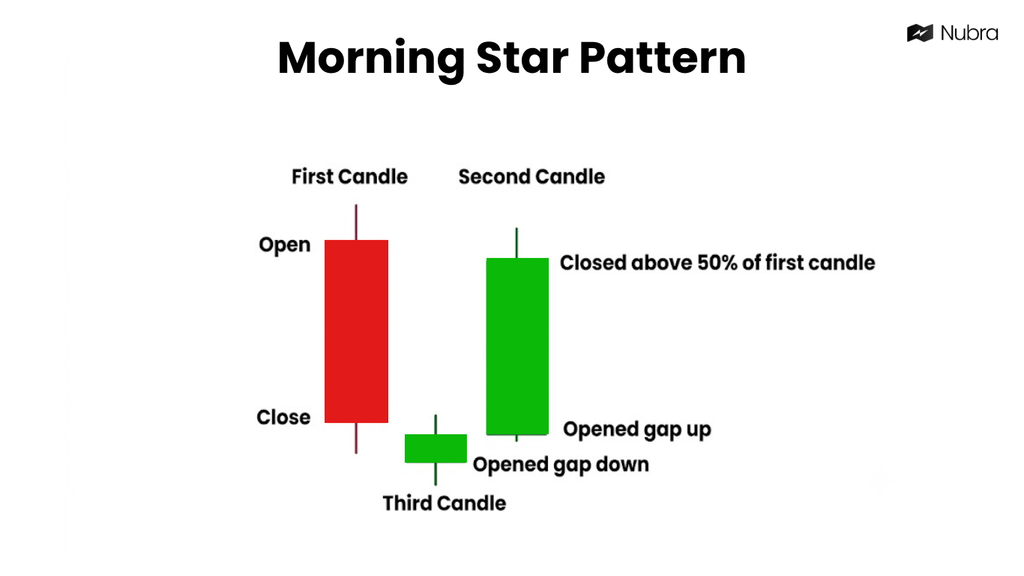
The morning star is a three-candle bullish reversal pattern. It usually forms after a downtrend and shows a shift from selling pressure to indecision to buying pressure.
The first candle is bearish and reflects seller control. The second candle is small and shows hesitation or reduced selling momentum. The third candle is bullish and closes meaningfully into the body of the first candle, showing that buyers have taken back control.
The morning star is useful because it captures a transition rather than a single moment. In a fast-moving market, that extra structure can make the signal easier to evaluate. The setup is stronger when the third candle closes with conviction and appears at a relevant support area. It becomes weaker if the third candle is small, volume is poor, or the broader market remains under pressure.
6. Three White Soldiers
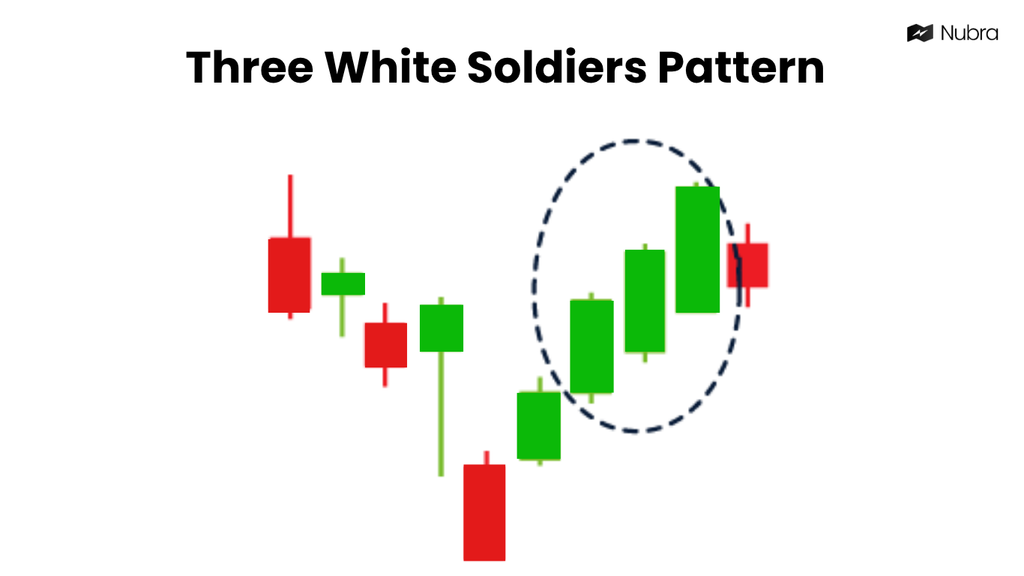
Three white soldiers is a bullish pattern made of three consecutive bullish candles, each closing higher than the previous candle. It can appear after a decline or after consolidation and suggests sustained buying interest.
Traders often like this pattern because it shows repeated buying rather than one isolated candle. But it also has a practical risk: by the time the third candle closes, the price may already have moved far from the ideal entry area. That can make risk-reward less attractive.
A cleaner way to read three white soldiers is to ask whether the pattern is breaking a meaningful level or simply chasing an extended move. If it appears after a base and breaks above resistance with improving volume, the structure is more useful. If it appears after a long, vertical rally, waiting for a pullback may be more sensible.
7. Tweezer Bottom
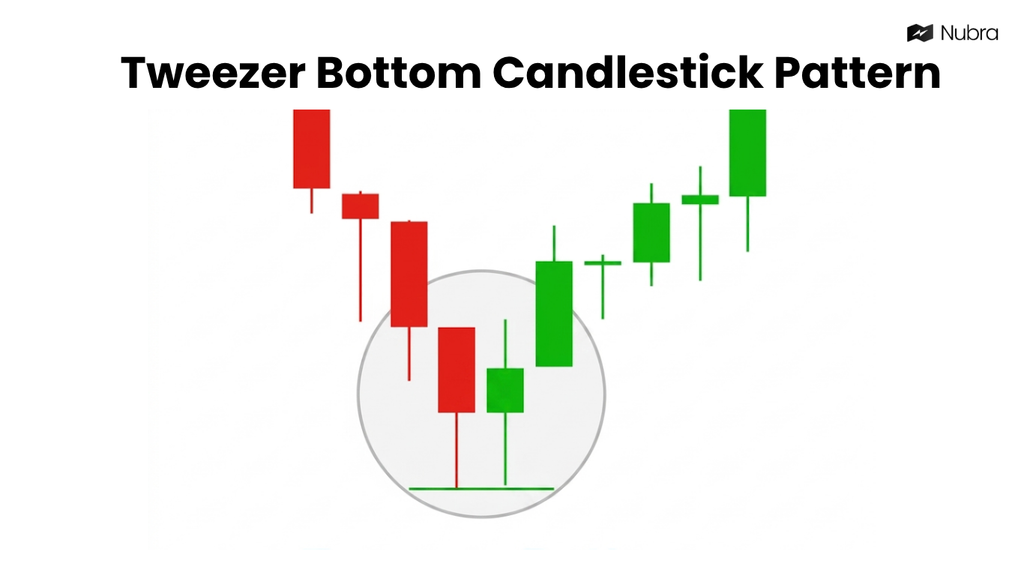
A tweezer bottom forms when two or more candles reject roughly the same low. It often appears after a decline and suggests that sellers tried to push price below a level but could not sustain the move.
The pattern is less about candle colour and more about the repeated defence of the same area. If price tests a support zone twice and buyers respond both times, traders may start watching that level as a demand area.
This pattern is often treated as higher-quality context when the second candle shows a stronger close or when the next candle confirms the bounce. It becomes weaker when the repeated low sits in the middle of a range without clear support, or when the broader trend is still strongly bearish.
8. Bullish Harami
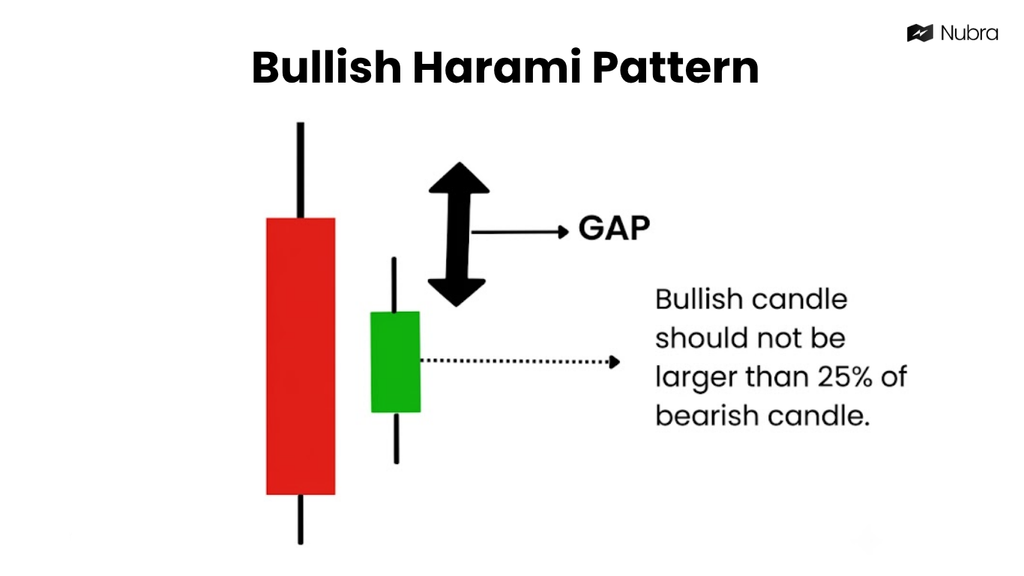
A bullish harami forms when a small bullish candle sits inside the body of the previous bearish candle. It usually appears after a decline and suggests that selling pressure may be slowing.
Compared with a bullish engulfing pattern, the bullish harami is a softer signal. Buyers have not overpowered the previous bearish candle; they have only stopped the immediate selling momentum. That makes confirmation important.
Traders often watch whether price can break above the high of the smaller candle or form a higher high after the pattern. If that happens near support, the bullish case improves. If price breaks below the larger bearish candle, the setup has failed.
9. Dragonfly Doji
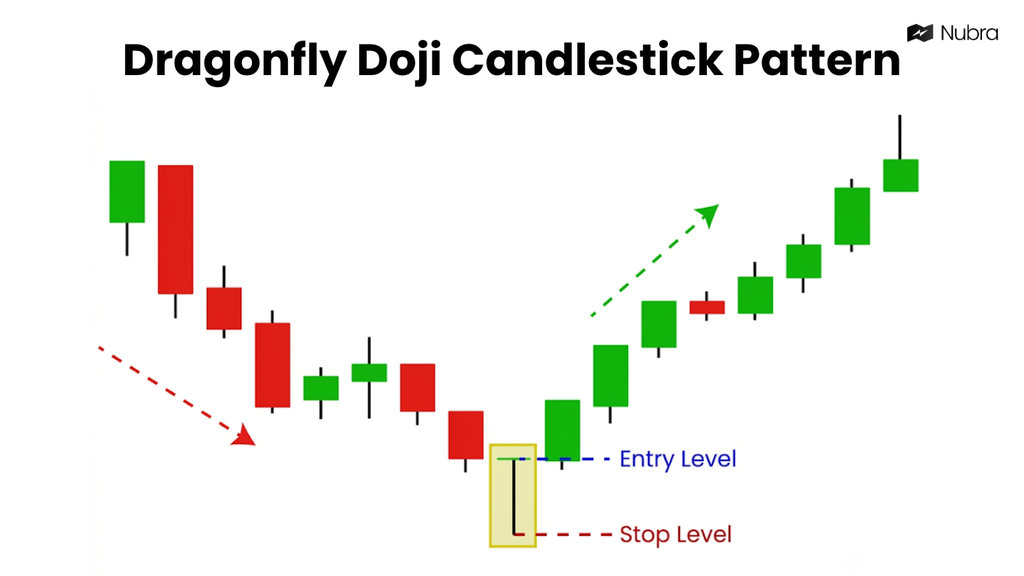
A dragonfly doji has little or no body, a long lower wick, and little or no upper wick. The open, high, and close are usually near the same area. After a decline, it can suggest that sellers pushed price lower but buyers pulled it back before the close.
The dragonfly doji is a useful rejection signal, but it should not be treated as a guaranteed reversal. It is most meaningful near a level where buyers already have a reason to respond, such as prior support, VWAP, or a demand zone.
In intraday trading, dragonfly dojis can appear frequently, especially during volatile sessions. That makes context even more important. A dragonfly doji on a noisy one-minute chart may not carry the same weight as one that forms on a 15-minute, hourly, or daily chart near a meaningful level.
Quick Comparison of Bullish Candlestick Patterns
| Pattern | Type | Typical Context | What to Confirm |
|---|---|---|---|
| Bullish engulfing | Reversal or pullback continuation | After decline or pullback | Support, volume, and higher close |
| Hammer | Reversal | After decline | Long lower wick near support |
| Inverted hammer | Reversal | After decline | Next candle closes higher |
| Piercing line | Reversal | After bearish candle | Close above prior candle midpoint |
| Morning star | Reversal | After downtrend | Strong third candle |
| Three white soldiers | Continuation or reversal | After base, pullback, or decline | Trend strength and risk-reward |
| Tweezer bottom | Reversal | Near support | Repeated low rejection |
| Bullish harami | Early reversal warning | After decline | Break above smaller candle |
| Dragonfly doji | Reversal warning | Near support after decline | Follow-through and level defence |
Using Bullish Candlestick Patterns in a Trading Workflow
Bullish candlestick patterns work best when they are part of a structured workflow, not when they are treated as standalone buy signals. A useful process starts with the pattern, then checks trend, levels, volume, open interest where relevant, and risk.
For F&O traders, the underlying chart is only one part of the decision. A bullish candle on Nifty or Bank Nifty may help identify where buyers are responding, but options traders still need to consider expiry, liquidity, implied volatility, Greeks, and open interest. A bullish chart setup can look attractive while the option contract itself has poor liquidity or unfavourable risk.
Nubra Charts can help traders review candlestick patterns alongside the underlying price action and key levels. For options trades, Nubra Option Chain provides strike-level data, including open interest, implied volatility and Greeks, while Nubra Strategy Builder supports payoff-scenario review. These tools help assess a setup; they do not confirm a reversal or guarantee a profitable trade.
Before acting on any bullish candlestick pattern, ask what would prove the setup wrong. If the answer is unclear, the trade plan is not ready. If the stop-loss is too wide, the pattern may be valid but impractical. If volume and follow-through are missing, the market may simply be pausing rather than reversing.
Trading involves market risk. This article is for educational purposes only and should not be treated as investment advice.
FAQs
Which bullish candlestick pattern is the most reliable?
No bullish candlestick pattern is reliable in every market. Bullish engulfing, hammer, morning star, and three white soldiers are widely followed, but they still need confirmation from trend, support, volume, and follow-through.
Do bullish candlestick patterns work in intraday trading?
Bullish candlestick patterns can be used in intraday trading, but shorter timeframes create more noise. Intraday traders should be stricter about liquidity, volume, market structure, and stop-loss placement.
What is the difference between a hammer and an inverted hammer?
A hammer has a long lower wick and shows rejection of lower prices. An inverted hammer has a long upper wick and shows that buyers tried to push price higher after a decline. Both need confirmation from the next candle.
Can bullish candlestick patterns be used for options trading?
They can help traders read the underlying index or stock chart before planning an options trade. Options traders should also check implied volatility, Greeks, expiry, liquidity, and open interest before making decisions.
Should bullish candlestick patterns be used alone?
No. Bullish candlestick patterns should be combined with market context, support and resistance, volume, and risk management. A pattern can signal possible buyer interest, but it cannot predict the market with certainty.
Can bullish candlestick patterns guarantee profit?
No. Bullish candlestick patterns do not guarantee profit or assured returns. They are technical analysis tools for reading price action and should be used with disciplined risk management.
Disclaimer: The information provided in this blog is for educational and informational purposes only and should not be construed as investment advice, financial advice, or a recommendation to buy, sell, or hold any securities or financial products. Investments in the securities market are subject to market risks. Please read all related documents carefully before investing. Readers should conduct their own research and consult a SEBI-registered investment adviser or other qualified financial professional before making any investment decisions. Past performance is not indicative of future results.