A hammer candlestick pattern is a single-candle technical analysis pattern that appears after a price decline and signals a possible bullish reversal. It does not confirm a reversal by itself, but it shows that sellers pushed the price lower during the session and buyers were able to pull it back near the opening or closing…
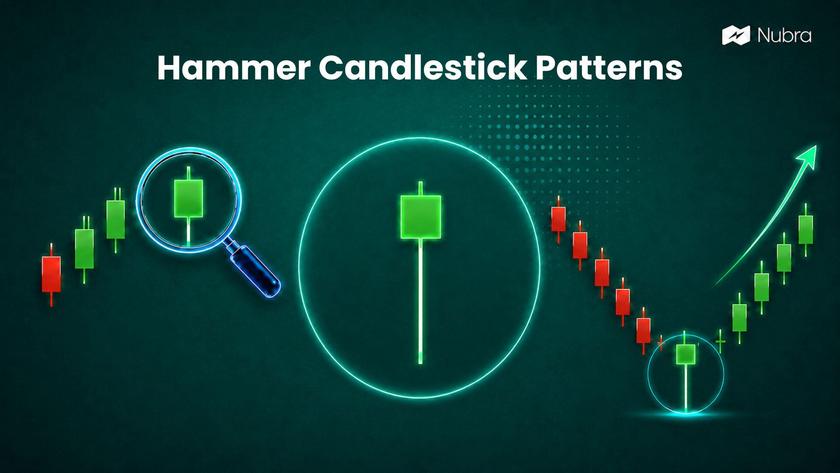
A hammer candlestick pattern is a single-candle technical analysis pattern that appears after a price decline and signals a possible bullish reversal. It does not confirm a reversal by itself, but it shows that sellers pushed the price lower during the session and buyers were able to pull it back near the opening or closing range.
For active traders, the hammer is useful because it compresses market psychology into one candle. A downtrend is already in place, selling pressure continues, the price falls further, and then buyers step in strongly enough to reject the lower level. That rejection is the key idea behind the pattern.
The practical reading is simple: a hammer can show that bearish momentum is weakening. The responsible trading reading is more careful: the pattern needs context, confirmation, and risk planning before it becomes useful.
What Is a Hammer Candlestick Pattern?
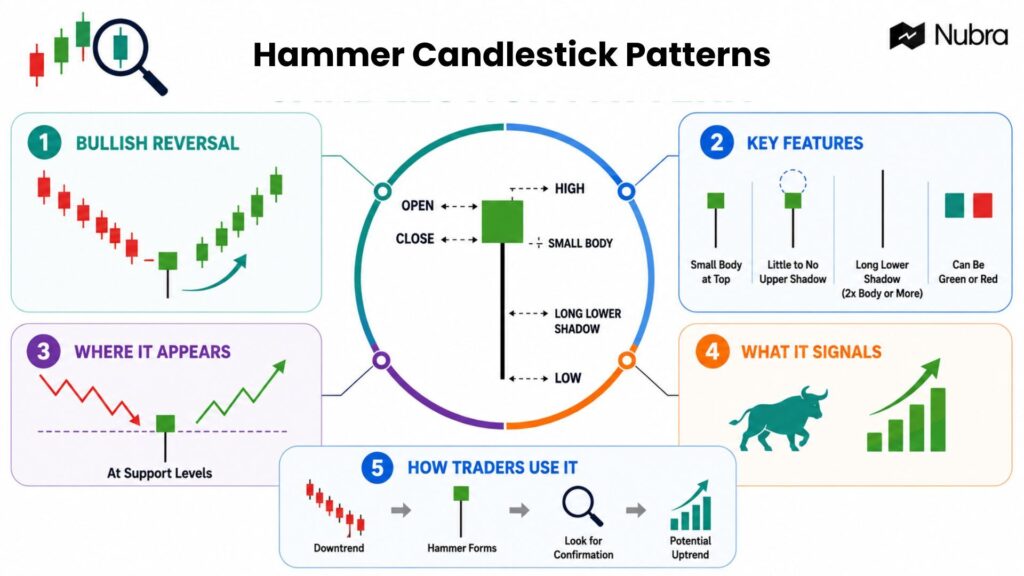
A hammer candlestick pattern is a bullish reversal candlestick pattern with a small real body near the top of the candle and a long lower wick. It usually forms near the end of a downtrend or after a sharp pullback.
The real body shows the difference between the opening and closing price. The lower wick shows how far the price fell during the session before recovering. In a valid hammer, the lower wick is usually at least twice the size of the real body. The upper wick is small or almost absent.
This shape matters because it shows rejection of lower prices. Sellers had control early in the candle, but buyers responded at lower levels and pushed the price back up. That does not mean the next candle must rise. It only means the previous selling pressure has been challenged.
For example, if Nifty has been falling for several sessions and then forms a candle with a small body near the top and a long lower shadow near a known support zone, traders may study it as an early reversal signal. The next step is not automatic buying. The next step is confirmation.
How a Hammer Candlestick Forms
A hammer forms when three things happen in the same candle:
1. The price opens and continues to move lower.
2. Sellers push the market to a new low for that session.
3. Buyers absorb the selling pressure and pull the price back near the open or above it.
The final candle looks like a hammer because the real body sits near the top and the lower wick extends below it. The lower wick is the important part. It shows that the market tested lower prices but could not stay there.
This is why the hammer is more meaningful after a downtrend. If the same candle appears in the middle of a sideways range, it may only show intraday volatility. If it appears after an uptrend, it may not carry the same bullish reversal meaning. Candlestick patterns are not just shapes; their location on the chart changes how they should be read.
How to Identify a Hammer Candlestick
A hammer candlestick is easier to identify when we check the structure and the trend together. The candle should have:
| Feature | What to Look For | Why It Matters |
| Prior trend | A clear decline or pullback before the candle | A hammer is mainly a bullish reversal signal after weakness |
| Small real body | Open and close are close to each other | Shows that the session ended near where it began, despite selling pressure |
| Long lower wick | Usually at least twice the size of the body | Shows rejection of lower prices |
| Little or no upper wick | Very small shadow above the body | Shows the price closed near the upper end of the session range |
| Confirmation | Follow-up bullish candle, support reaction, volume, or indicator support | Helps reduce false signals |
The candle can be green or red. A green hammer, where the close is above the open, is often treated as stronger because buyers managed to close the session positively. A red hammer can still matter if the lower wick is strong and the candle appears after a decline, but it usually needs stronger confirmation.
Types of Hammer Candlestick Patterns
The two common hammer-style patterns are the classic hammer and the inverted hammer. Both are studied after a downtrend, but they communicate buying pressure in different ways.
Classic Hammer Candlestick
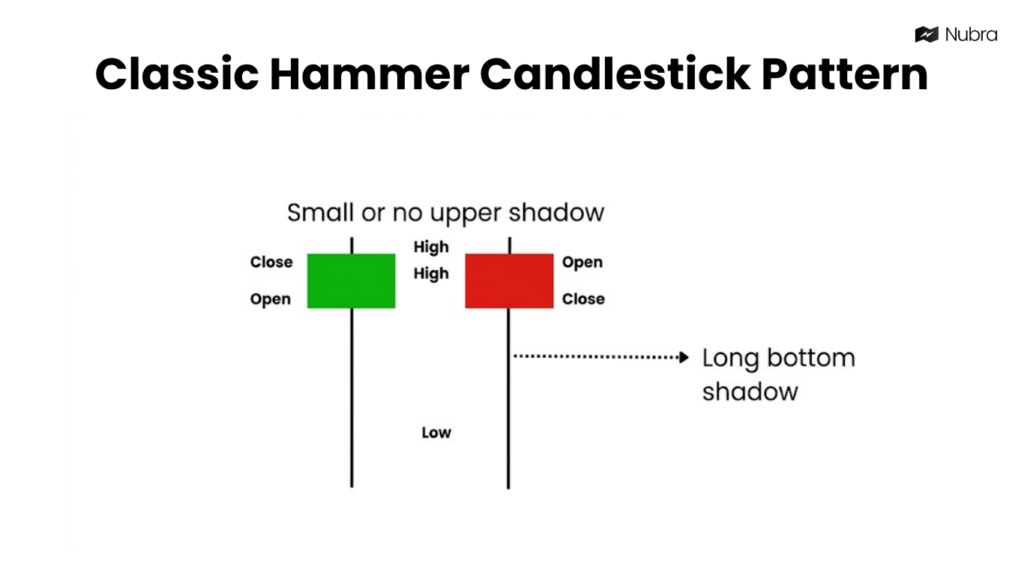
The classic hammer has a small body near the top and a long lower wick. It shows that sellers pushed the price down, but buyers rejected the lower level before the candle closed.
This is the version traders usually mean when they say “hammer candlestick.” It is considered a possible bullish reversal pattern, especially when it forms near support, after a visible downtrend, or after a sharp pullback into a demand zone.
A stronger classic hammer usually has a long lower wick, a small upper wick, a close near the top of the candle, and higher-than-usual volume. Even then, traders usually wait for the next candle to confirm that buying interest has continued.
Inverted Hammer Candlestick
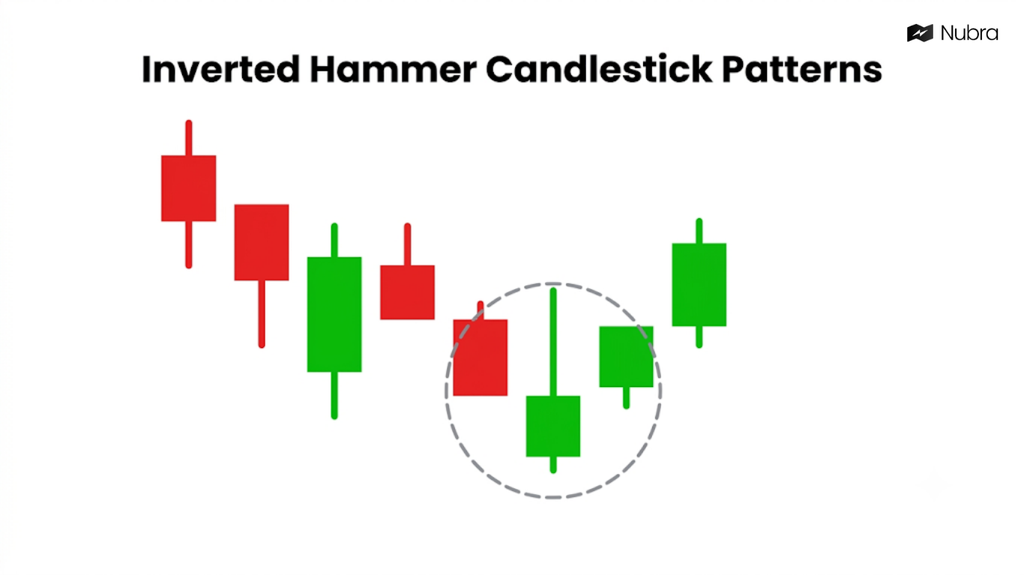
The inverted hammer has a small body near the bottom and a long upper wick. It also appears after a decline, but its psychology is slightly different.
In this case, buyers pushed the price higher during the session, but sellers pulled it back before the close. The candle still shows that buyers tried to challenge the downtrend, but the close is not as strong as a classic hammer. That is why the inverted hammer often needs clearer follow-through from the next candle.
An inverted hammer should not be confused with a shooting star. The shape can look similar, but the trend context is different. An inverted hammer appears after a downtrend and is studied as a potential bullish reversal. A shooting star appears after an uptrend and is studied as a potential bearish reversal.
What the Hammer Pattern Indicates
A hammer pattern indicates a possible shift from selling pressure to buying pressure. The lower wick tells us that sellers pushed the price down. The recovery into the close tells us that buyers were active at lower levels.
The pattern is most useful when it appears where traders already expect a reaction. That could be a previous support zone, a trendline, a moving average, a Fibonacci retracement level, or a broader market level watched by many participants. In Indian markets, traders may also look at index context, sector movement, expiry-day behaviour, open interest changes, and the broader trend in Nifty or Bank Nifty before reading the candle.
The hammer should not be treated as a prediction. It is better understood as a signal to pay closer attention. If the next candle closes above the hammer high, if volume expands, or if momentum indicators stop weakening, the case for a reversal becomes more credible. If the next candle breaks below the hammer low, the signal has likely failed.
How Traders Use Hammer Candlestick Patterns
Traders usually use the hammer pattern as part of a confirmation-led workflow rather than as a standalone trading signal. The candle can highlight a possible reversal, but the trade setup becomes more meaningful when trend, support, confirmation, risk and broader market context agree.
A practical workflow can look like this:
- Check the prior trend: Confirm that the instrument is in a clear downtrend or pullback. A hammer appearing in the middle of a sideways range may carry less significance.
- Identify where the hammer forms: Look for the pattern near a meaningful support area, previous swing low, moving average, trendline or another level where buyers may respond.
- Wait for confirmation: Traders may look for a bullish candle closing above the hammer high, stronger volume, a recovery above a short-term moving average or improving momentum indicators such as RSI.
- Review broader market signals: Depending on the instrument, traders may also consider index direction, sector behaviour, open interest, option-chain data and expiry context before forming a view.
- Define the invalidation level: The hammer low is often used as a reference point because a sustained move below it suggests that the earlier rejection of lower prices has failed.
- Check the available trading range: Nearby resistance should also be considered. If resistance is too close, the setup may offer limited room even when the hammer itself looks technically valid.
Use Nubra Charts to review the hammer alongside the preceding trend and support levels. For an options setup, Nubra Option Chain provides strike-level open interest, implied volatility and Greeks, while Nubra Strategy Builder helps compare payoff scenarios. These tools support confirmation and risk review; the candle alone does not establish a suitable trade.
Hammer Candlestick vs Similar Candlestick Patterns
Several single-candle patterns can look similar at first glance. The easiest way to separate them is to check the wick direction and the trend before the candle.
| Pattern | Usual Location | Shape | Common Interpretation |
| Hammer | After a downtrend | Small body near top, long lower wick | Possible bullish reversal |
| Inverted hammer | After a downtrend | Small body near bottom, long upper wick | Possible bullish reversal, needs confirmation |
| Hanging man | After an uptrend | Small body near top, long lower wick | Possible bearish reversal |
| Shooting star | After an uptrend | Small body near bottom, long upper wick | Possible bearish reversal |
| Doji | Any market phase | Open and close nearly equal | Indecision, context decides meaning |
This comparison is important because the same shape can mean different things in different locations. A hammer-like candle after a strong rally is not read the same way as a hammer after a decline. Traders who only match the shape without checking the prior trend may end up reading the signal incorrectly.
Benefits and Limitations of the Hammer Pattern
The hammer candlestick pattern is popular because it is simple to spot and gives a clear visual signal when selling pressure is being challenged. It can help traders identify areas where the market may be trying to form a bottom, especially when the candle appears near support.
At the same time, the pattern has clear limitations. A hammer can fail. It can appear in weak markets before the price continues lower. It can also appear during noisy intraday moves where the signal has little meaning.
| Benefits | Limitations |
| Easy to identify on candlestick charts | Can generate false reversal signals |
| Shows rejection of lower prices | Needs trend context to be meaningful |
| Works across timeframes | Reliability varies by timeframe and liquidity |
| Can support entry and stop-loss planning | Does not provide a profit target by itself |
| Becomes stronger with support, volume, and confirmation | Should not be used alone as a trading decision |
The useful approach is to treat the hammer as one part of the chart, not the whole chart. It becomes more valuable when it agrees with support, volume, momentum, and a clear invalidation level.
Example of a Hammer Candlestick in an Indian Market Context
Assume a stock has been falling for several sessions. It opens at ₹500, falls to ₹470 during the session, and then recovers to close at ₹498. The candle has a small body near the top and a long lower wick.
This candle suggests that sellers tried to extend the fall, but buyers were active near ₹470. If ₹470 also matches a previous support zone, the hammer becomes more interesting. If the next candle closes above ₹505 with stronger volume, traders may read it as confirmation that buyers are following through.
The risk point is equally important. If the price falls below ₹470 after the hammer, the original reversal idea becomes weaker because the market has moved below the level where buyers previously defended the price.
This kind of example shows why confirmation matters. The hammer helps frame the setup, but support, follow-through, and invalidation decide whether the setup is worth studying further.
Is the Hammer Candlestick Pattern Reliable?
The hammer candlestick pattern can be useful as an early reversal signal, but it is not reliable enough to use alone. The setup becomes more credible when it appears after a clear downtrend, near support, with visible rejection from lower levels, and with confirmation from the next candle or supporting indicators.
The pattern becomes weaker when it appears in a sideways market, on low volume, far from support, or against a strong broader market decline. It also becomes weaker when the next candle fails to hold above the hammer body or breaks below the hammer low.
For that reason, a balanced reading is more useful: a hammer can be an early warning that selling pressure is weakening, but the market still needs to confirm the reversal.
Final Takeaway
The hammer candlestick pattern is a simple but useful way to read possible bullish reversal pressure after a downtrend. Its long lower wick shows that sellers pushed prices down, but buyers rejected those lower levels before the candle closed.
For traders, the real value of the hammer comes from context. A valid hammer should be checked against the prior trend, support levels, confirmation candles, volume, and risk-reward. It can help structure a trading idea, but it should not be treated as a guaranteed signal or standalone strategy.
Trading involves market risk. This page is for educational purposes only and should not be treated as investment advice. Candlestick examples do not guarantee returns, and a disciplined workflow matters more than any single candle.
FAQs
What is a hammer candlestick pattern?
A hammer candlestick pattern is a bullish reversal pattern that usually appears after a downtrend. It has a small body near the top of the candle and a long lower wick, showing that buyers rejected lower prices.
Is a hammer candlestick bullish or bearish?
A hammer candlestick is generally considered bullish when it forms after a downtrend. It signals a possible reversal, but traders usually wait for confirmation before acting on it.
What is the difference between a hammer and an inverted hammer?
A hammer has a long lower wick and a small body near the top. An inverted hammer has a long upper wick and a small body near the bottom. Both are studied after downtrends, but the inverted hammer usually needs stronger confirmation.
Does the colour of a hammer candle matter?
The colour can matter, but it is not the only factor. A green hammer is often considered stronger because the price closes above the open. A red hammer can still be useful if it forms after a downtrend and receives confirmation.
How do traders confirm a hammer candlestick?
Traders often look for the next candle to close above the hammer high or close. They may also check support levels, trading volume, RSI, moving averages, or broader market context.
Where should a stop-loss be placed for a hammer pattern?
Many traders use the hammer low as an invalidation reference because a move below that level weakens the reversal signal. The exact stop-loss depends on the trader’s risk plan, instrument, and timeframe.
Can hammer candlestick patterns be used for intraday trading?
Yes, hammer patterns can appear on intraday charts, daily charts, and weekly charts. Shorter timeframes can produce more noise, so confirmation and liquidity checks become even more important.
Is the hammer candlestick pattern enough to enter a trade?
No. A hammer is a setup signal, not a complete trading plan. It should be combined with trend context, support and resistance, confirmation, volume, and risk management.
Disclaimer: The information provided in this blog is for educational and informational purposes only and should not be construed as investment advice, financial advice, or a recommendation to buy, sell, or hold any securities or financial products. Investments in the securities market are subject to market risks. Please read all related documents carefully before investing. Readers should conduct their own research and consult a SEBI-registered investment adviser or other qualified financial professional before making any investment decisions. Past performance is not indicative of future results.