The debt-to-equity ratio shows how much debt a company has compared with the money owned by shareholders. It is one of the simplest ways to check whether a company is funding itself mainly through borrowings or through its own equity base. In simple words, the debt-to-equity ratio, or D/E ratio, compares borrowed money with owners’ […]
Debt to Equity Ratio: Meaning, Formula, Calculation and Interpretation

The debt-to-equity ratio shows how much debt a company has compared with the money owned by shareholders. It is one of the simplest ways to check whether a company is funding itself mainly through borrowings or through its own equity base.
In simple words, the debt-to-equity ratio, or D/E ratio, compares borrowed money with owners’ money. A high D/E ratio means the company depends more on lenders. A low D/E ratio means it depends more on shareholder funds.
The number is not good or bad by itself. Debt can help a company grow faster. It can also create pressure when interest costs rise, margins fall, or earnings become weak. That is why D/E should be read with sector context, cash flow, interest coverage, and recent price behaviour.
What Is the Debt to Equity Ratio?
The debt-to-equity ratio is a leverage ratio. It shows the relationship between a company’s debt and shareholders’ equity.
Shareholders’ equity is the owners’ remaining claim in the business after liabilities are considered. On a balance sheet, it usually includes equity share capital, reserves, retained earnings, and other equity items.
Debt usually includes short-term borrowings and long-term borrowings. Some analysts use total liabilities instead. This is important because the result can change depending on the definition used.
Before comparing two companies, check which version of the ratio is being used. If one source uses total debt and another uses total liabilities, the two numbers should not be compared directly.
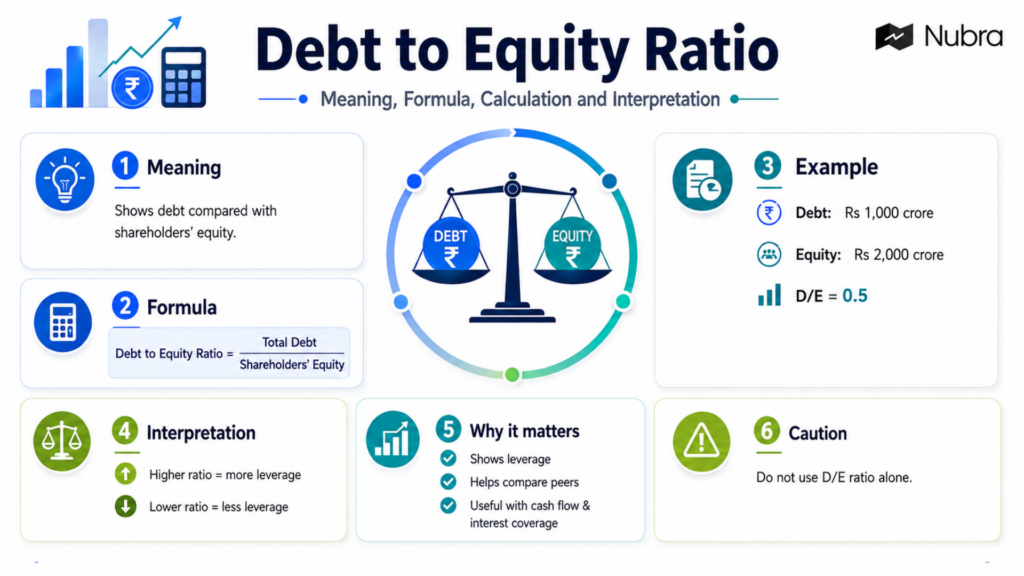
Debt to Equity Ratio Formula
The common formula is:
Debt to Equity Ratio = Total Debt / Shareholders’ Equity
Some explainers use this version:
Debt to Equity Ratio = Total Liabilities / Shareholders’ Equity
For listed-company analysis, the total-debt version is usually more useful because it focuses on interest-bearing obligations. For overall solvency analysis, total liabilities can also be useful because trade payables, lease obligations, provisions, and other liabilities can still affect the company.
The two main inputs come from the balance sheet:
| Input | Meaning | Where to look |
|---|---|---|
| Total debt | Short-term borrowings plus long-term borrowings | Liabilities side of the balance sheet |
| Shareholders’ equity | Equity share capital, reserves, and other shareholder funds | Equity section of the balance sheet |
How to Calculate Debt to Equity Ratio
Here is a simple example.
Suppose a company has:
| Particulars | Amount |
|---|---|
| Short-term borrowings | Rs 250 crore |
| Long-term borrowings | Rs 750 crore |
| Shareholders’ equity | Rs 2,000 crore |
First, calculate total debt:
Total debt = Rs 250 crore + Rs 750 crore = Rs 1,000 crore
Then divide total debt by shareholders’ equity:
Debt to Equity Ratio = Rs 1,000 crore / Rs 2,000 crore = 0.5
A D/E ratio of 0.5 means the company has 50 paise of debt for every Rs 1 of shareholder equity. This looks conservative, but it should still be compared with peers, profitability, cash flow, and interest obligations.
Now consider another company:
| Particulars | Amount |
|---|---|
| Total debt | Rs 3,000 crore |
| Shareholders’ equity | Rs 1,500 crore |
Debt to Equity Ratio = Rs 3,000 crore / Rs 1,500 crore = 2
This means the company has Rs 2 of debt for every Rs 1 of shareholder equity. That is a more leveraged balance sheet. It may be normal in some sectors, but the next question is whether the company earns enough cash to service that debt.
How to Interpret a High Debt to Equity Ratio
A high D/E ratio means debt has a large role in the company’s capital structure. This can be useful when debt is funding productive assets. It can become risky when debt grows faster than earnings, cash flow, or asset quality.
For example, infrastructure, power, manufacturing, and telecom companies may naturally carry more debt because their projects need large upfront investment. A software or asset-light services company may have a much lower D/E ratio because it does not need the same level of plant, machinery, or project financing.
So a blanket rule such as “high D/E is always bad” can be misleading. The better questions are: Is the company in a debt-heavy industry? Is cash flow stable? Is interest coverage healthy?
This becomes important around quarterly results, credit-rating changes, capex announcements, or sharp price moves. A high D/E ratio can make the market more sensitive to bad news because debt reduces flexibility.
How to Interpret a Low Debt to Equity Ratio
A low D/E ratio means the company uses less debt compared with shareholder funds. This often points to a more conservative balance sheet. It may also mean the company has less financial stress in difficult periods because interest and repayment obligations are lower.
But low D/E does not automatically mean better management. A company can be debt-light because it is profitable and cash-rich. It can also be debt-light because it is not reinvesting enough or does not have strong growth opportunities.
That is why D/E should be compared with return on equity, return on capital employed, revenue growth, and free cash flow.
For an active trader, the key point is simple: low leverage may reduce balance-sheet risk, but it does not remove market risk. A low-debt company can still fall if earnings disappoint, valuations are stretched, or sector sentiment weakens.
What Is a Good Debt to Equity Ratio?
There is no single good debt-to-equity ratio for every company. A D/E ratio below 1 is often viewed as more conservative because debt is lower than equity. A D/E ratio above 1 means debt is higher than equity. A ratio near or above 2 usually needs closer review, especially outside sectors where heavy borrowing is normal.
The ratio becomes more useful when checked against five things:
| Check | Why it matters |
|---|---|
| Past trend | Shows whether leverage is rising or falling |
| Direct competitors | Compares similar business models |
| Sector norms | Avoids unfair cross-sector comparisons |
| Cash flow and profitability | Shows whether debt can be serviced |
| Current valuation | Shows whether the market may already be pricing the risk |
This helps avoid a common mistake: comparing a bank, an infrastructure company, and an IT services company as if they use the same balance-sheet model.
What Negative Debt to Equity Ratio Means
A negative D/E ratio usually appears when shareholders’ equity is negative. This can happen when accumulated losses have reduced the company’s net worth.
Negative equity should be treated as a separate red flag, not as a normal high or low D/E reading. Before drawing any conclusion, check why equity is negative and whether the issue is temporary or structural.
How Traders Can Use Debt to Equity Ratio in Stock and F&O Research
When screening a stock, D/E helps show balance-sheet risk. If two companies have similar revenue growth but one has much higher leverage, the higher-debt company may react more sharply to weak earnings, rising interest costs, or delayed cash flows.
For equity delivery trades, D/E can be part of fundamental filtering. For F&O names, it works better as risk context, not as a trade trigger. A stock with high leverage can still trend strongly, and a debt-light stock can still break down.
For example, if a highly leveraged company reports weak quarterly results, management commentary on debt reduction, refinancing, working capital, and capex becomes more important. If the stock is also near an important technical level, the balance-sheet risk adds context to the trade plan.
The ratio does not tell anyone what to trade. It helps traders avoid reading price action without understanding the company’s financial pressure.
This is where a structured trading workflow helps. On Nubra, where the relevant tools are available, the educational use case is to combine ratio awareness with charts, market data, watchlists, and risk controls. The goal is not to predict outcomes with certainty. It is to make the research process more disciplined.
Limitations of Debt to Equity Ratio
The D/E ratio is useful, but it has limits.
First, total debt and total liabilities are not the same thing. Always check the definition before comparing ratios.
Second, the ratio is based on balance-sheet values from a reporting date. Debt can change after the quarter ends because of repayments, refinancing, acquisitions, or new borrowings.
Third, D/E does not show whether the company can pay interest comfortably. For that, also check interest coverage, operating cash flow, debt maturity schedule, and credit-rating commentary where available.
Fourth, the ratio does not capture market valuation. A leveraged company can still be cheap or expensive depending on earnings expectations, sector cycle, and investor sentiment.
That is why D/E should be used as a starting point, not a final verdict.
Quick Summary
| Point | Explanation |
|---|---|
| Meaning | D/E compares debt with shareholders’ equity. |
| Formula | Total debt divided by shareholders’ equity. |
| High ratio | More dependence on borrowing; needs sector and cash-flow context. |
| Low ratio | More dependence on equity; often conservative but not automatically better. |
| Best use | Compare with peers, past trend, cash flow, profitability, and interest coverage. |
| Main caution | Do not use D/E alone as an investment or trading decision. |
FAQs
What is the debt-to-equity ratio?
The debt-to-equity ratio compares a company’s debt with its shareholders’ equity. It helps show how much the company depends on borrowings.
What is the formula for debt-to-equity ratio?
The common formula is: Debt to Equity Ratio = Total Debt / Shareholders’ Equity. Some analysts use total liabilities instead of total debt, so the definition should be checked before comparing numbers.
Is a high debt-to-equity ratio always bad?
No. A high D/E ratio is not always bad because some sectors naturally use more debt. It becomes more concerning when debt is high, cash flow is weak, interest costs are rising, or earnings are volatile.
What is a good debt-to-equity ratio?
There is no universal good ratio. A D/E ratio below 1 is often considered conservative, while a ratio above 1 shows greater debt dependence. The right interpretation depends on the sector, peer group, cash flow, and profitability.
Where can debt and equity numbers be found?
Debt and equity numbers are available in the company’s balance sheet. Debt is usually listed under short-term and long-term borrowings. Shareholders’ equity appears under equity share capital, reserves, and other equity items.
Can the debt-to-equity ratio be negative?
Yes. A negative D/E ratio can appear when shareholders’ equity is negative. This usually needs careful review because it may point to accumulated losses or balance-sheet stress.
Should traders check debt-to-equity ratio before F&O trades?
For F&O trades, D/E is better treated as background risk context, not as a direct signal. It can help show whether a stock may be more sensitive to earnings misses, interest-rate changes, refinancing news, or debt-related commentary.
Disclaimer:This article is for educational purposes only and should not be treated as investment advice. Trading and investing involve market risk, and outcomes depend on market conditions, execution, and individual decisions.
Published Aug 6, 2026