What Is Interest Coverage Ratio? Interest coverage ratio is a solvency ratio that shows how comfortably a company can pay interest on its debt from operating earnings. It shows whether the business earns enough before interest and tax to handle finance costs. Debt stress often appears before a company misses a repayment. If interest expense […]
Interest Coverage Ratio
What Is Interest Coverage Ratio?
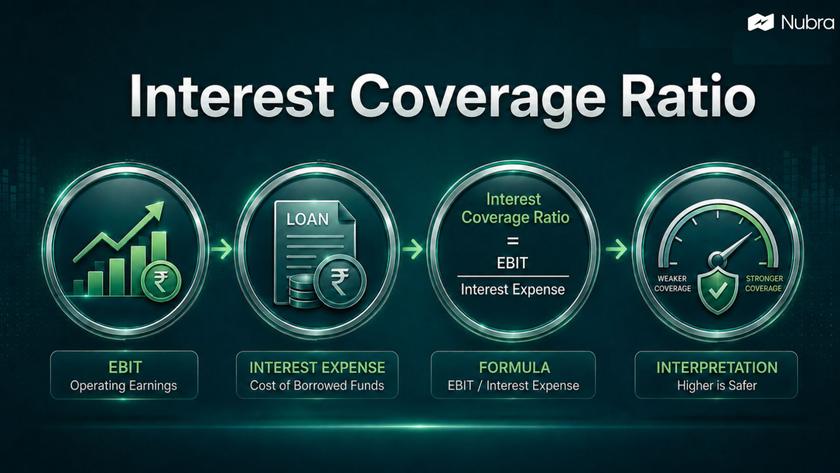
Interest coverage ratio is a solvency ratio that shows how comfortably a company can pay interest on its debt from operating earnings. It shows whether the business earns enough before interest and tax to handle finance costs.
Debt stress often appears before a company misses a repayment. If interest expense rises faster than operating profit, the company has less room to absorb pressure. That makes this ratio a useful early warning signal in debt-heavy sectors. This article is for educational purposes only and should not be treated as investment advice.
Interest Coverage Ratio Formula
The standard formula is:
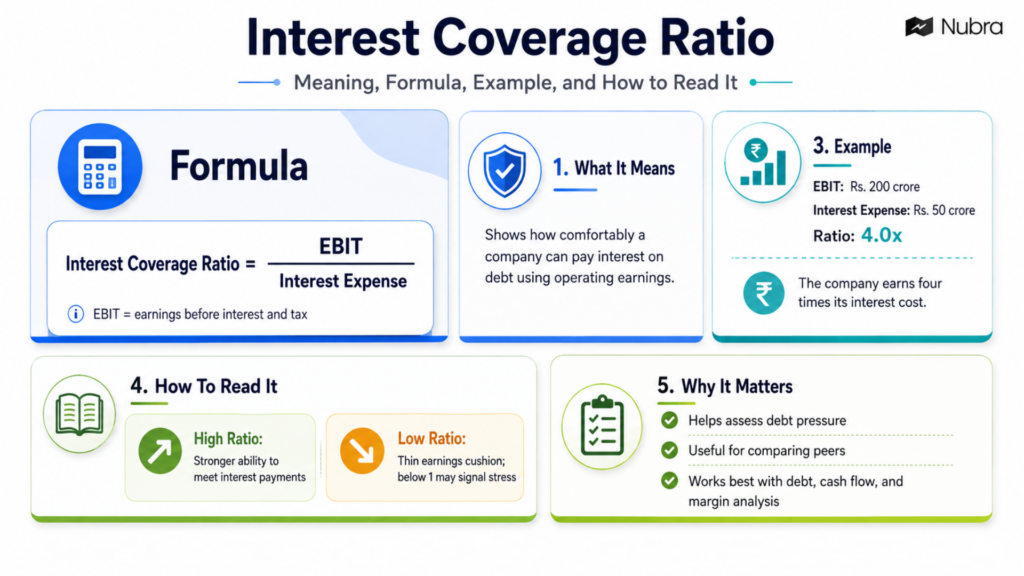
Interest Coverage Ratio = EBIT / Interest Expense
EBIT means earnings before interest and tax. Interest expense is the finance cost paid on borrowings, depending on how the company reports its statements.
Some analysts use EBITDA instead of EBIT:
EBITDA Interest Coverage Ratio = EBITDA / Interest Expense
The two versions are not identical. EBITDA adds back depreciation and amortisation, so it can make asset-heavy companies look stronger. EBIT is stricter. For infrastructure, telecom, power, cement, metals, and real estate, that difference can matter.
How To Calculate Interest Coverage Ratio
Suppose a company reports these numbers:
| Metric | Amount |
|---|---|
| Revenue | Rs. 1,000 crore |
| Operating expenses before depreciation | Rs. 680 crore |
| Depreciation and amortisation | Rs. 120 crore |
| EBIT | Rs. 200 crore |
| Interest expense | Rs. 50 crore |
The interest coverage ratio is:
Rs. 200 crore / Rs. 50 crore = 4.0
This means the company earned four times its interest cost from operations. That is more comfortable than 1.2 times coverage because the profit cushion is larger.
If EBIT falls to Rs. 80 crore while interest expense remains Rs. 50 crore, the ratio becomes 1.6. The company is still covering interest, but the cushion is thinner. In that case, the next step is to check whether the decline is temporary or linked to higher borrowing costs.
What A High Or Low Interest Coverage Ratio Means
A high interest coverage ratio usually means the company has a stronger ability to meet interest payments. A company with EBIT of Rs. 500 crore and interest expense of Rs. 50 crore has 10 times coverage.
But a high ratio should not be read in isolation. If coverage has moved from 15 times to 10 times to 6 times, the trend needs a closer look. A company can also have high coverage today and still face future pressure if it is adding debt aggressively.
A low ratio means the earnings cushion is thin. A ratio near 1 means most operating profit is being consumed by interest. A ratio below 1 means EBIT is not enough to cover interest expense. If EBIT is negative, the ratio may also be negative, which usually means the company is making an operating loss before interest costs. For traders, this can affect how a stock reacts to earnings, rating actions, refinancing news, or rate expectations.
What Is A Good Interest Coverage Ratio?
There is no single “good” interest coverage ratio for every company. Many analysts become more comfortable when coverage is above 2 or 3 times. A ratio below 1.5 times deserves closer review, especially for cyclical businesses or during rising-rate periods.
Sector context matters. A software company with low debt should usually have stronger coverage than a capital-intensive infrastructure company. A utility, telecom, metal, real estate, or power business may carry more debt, so peer comparison is important.
The rate cycle also matters. When rates rise, floating-rate debt can become costlier. When demand slows, EBIT can fall. The ratio captures pressure from both sides.
Why Interest Coverage Ratio Matters For Traders And Investors
The interest coverage ratio works best as a risk filter, not as a buy or sell signal. It helps traders and investors ask better questions before looking at chart setups, earnings momentum, valuations, or derivative activity.
For a long-term investor, the ratio helps assess financial durability. A company that consistently covers interest has more flexibility to reinvest.
For an active trader, the ratio can explain why some stocks move sharply around results or debt-related news. In F&O or options-led workflows, interest coverage should not be used to choose a strategy directly, but it can help frame event risk.
A stronger workflow combines fundamental checks like interest coverage with charts, watchlists, sector context, option-chain behaviour, and scenario planning. The ratio does not predict trade outcomes.
How To Use It With Other Metrics
Interest coverage becomes more useful when it is combined with debt-to-equity, operating cash flow, net debt / EBITDA, margins, revenue trend, and credit rating changes. Together, these checks show whether the company has the cash-flow strength to handle debt.
The ratio should not be used mechanically. A company with 6 times coverage is not automatically better than one with 3 times coverage if the first has declining cash flows and the second has improving earnings.
Unrelated businesses should not be compared too directly. A bank, an NBFC, an IT services company, a cement company, and a telecom company have different balance-sheet structures. The ratio works best across similar companies or across the same company over time.
Limitations Of Interest Coverage Ratio
The interest coverage ratio has limits. EBIT is an accounting measure, not cash in the bank. A company may report operating profit while still facing working-capital pressure.
The ratio focuses on interest expense, not total debt repayment. Principal repayments, lease obligations, refinancing needs, and covenants can matter too.
It is also backward-looking. If commodity prices, demand, borrowing costs, or regulation change after the reporting period, the old ratio may not reflect current risk. Sudden jumps or drops can also come from one-time gains, exceptional losses, or seasonal earnings.
That is why interest coverage should be treated as a starting point. It shows where to look, but it does not replace a full review of cash flows, debt maturity, sector cycle, and price behaviour.
Interest Coverage Ratio Example In Stock Analysis
Assume two companies in the same sector are being compared:
| Company | EBIT | Interest Expense | Interest Coverage Ratio |
|---|---|---|---|
| Company A | Rs. 300 crore | Rs. 60 crore | 5.0 |
| Company B | Rs. 300 crore | Rs. 150 crore | 2.0 |
Both companies generate the same EBIT, but Company A has a larger cushion. If sector margins fall and EBIT drops by 30%, Company A’s coverage falls to 3.5, while Company B’s coverage falls to 1.4. Company B may need closer review on refinancing plans and cash-flow quality.
Interest Coverage Ratio FAQs
What is interest coverage ratio in simple words?
Interest coverage ratio shows how many times a company can pay interest expense from operating earnings.
What is the formula for interest coverage ratio?
The common formula is EBIT divided by interest expense. Some analysts use EBITDA divided by interest expense.
Is a higher interest coverage ratio always better?
A higher ratio is generally more comfortable, but it is not enough by itself. The trend, sector norms, cash flow, debt maturity, and new borrowing also matter.
What does an interest coverage ratio below 1 mean?
A ratio below 1 means EBIT is not enough to cover interest expense for the period. This can signal financial stress, but the reason must be checked before forming a view.
How is interest coverage ratio useful for stock traders?
It helps traders understand debt-related risk behind a stock and judge whether earnings weakness, rate changes, or refinancing news could create sharper price reactions.
Disclaimer: The information provided in this blog is for educational and informational purposes only and should not be construed as investment advice, financial advice, or a recommendation to buy, sell, or hold any securities or financial products. Investments in the securities market are subject to market risks. Please read all related documents carefully before investing. Readers should conduct their own research and consult a SEBI-registered investment adviser or other qualified financial professional before making any investment decisions. Past performance is not indicative of future results.
Published Aug 7, 2026