A long-legged doji is a candlestick with almost identical opening and closing prices and long upper and lower shadows. It shows that price travelled in both directions during the period but finished close to where it started. When we see this candle, we have evidence of an unsettled session. We do not yet have a…
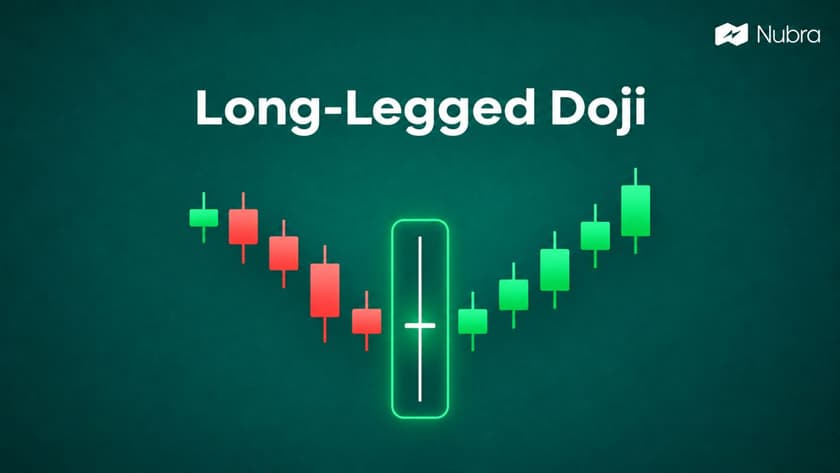
A long-legged doji is a candlestick with almost identical opening and closing prices and long upper and lower shadows. It shows that price travelled in both directions during the period but finished close to where it started.
When we see this candle, we have evidence of an unsettled session. We do not yet have a clear bullish or bearish signal. The useful question is what happens around its high and low, especially when it appears near an established support or resistance level.
In this guide, we will work through the candle’s structure, what confirmation can tell us, and how to assess risk using hypothetical Indian-market examples. We will also connect the chart reading to options analysis, where getting the underlying direction right is only part of the decision.
What is a Long-Legged Doji?
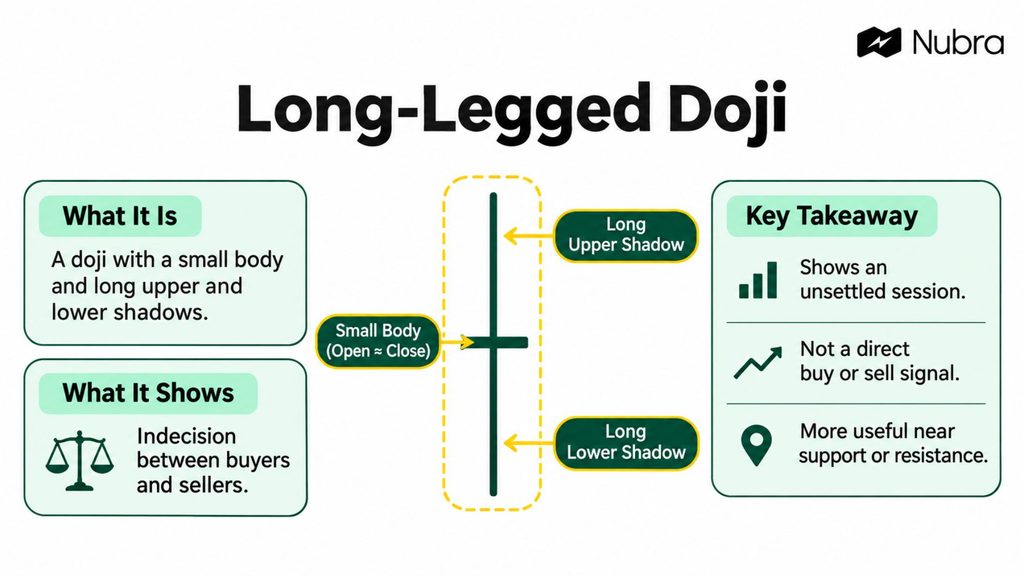
A long-legged doji combines a very small real body with extended shadows on both sides. The real body is the distance between the opening and closing prices. The shadows, also called wicks, show how far price moved beyond those levels.
The candle captures a contrast: substantial movement within the period, followed by little net movement between the open and close. This is why we interpret it as indecision rather than sustained control by either side.
The pattern can appear after a rally, after a decline or within a sideways market. Its existence does not depend on a prior trend. However, a candle that interrupts a clear trend may raise a more useful question than another indecisive candle in an already congested range.
We can place it within the wider family of patterns using our guide to candlestick patterns. The name helps us recognise the shape; the surrounding chart helps us decide whether the shape matters.
How Do We Identify a Long-Legged Doji?
We start with a completed candle and check the relationship between its open, high, low and close. A candle that looks like a doji halfway through a session can finish with a large body, so identifying an unfinished candle can change the analysis.
A Very Small Real Body
The open and close should be equal or close together relative to the candle’s range. A small green or red body is possible. Its colour tells us which price was slightly higher, but that small difference does not establish the direction of the next move.
There is no single percentage threshold accepted across every charting platform. Some scanners compare the body with recent average bodies, while others use a proportion of the candle’s range. We need to know which definition a tool uses before interpreting its results.
Long Upper and Lower Shadows
Both shadows should be visibly extended. The upper shadow records prices above the body; the lower shadow records prices below it. We compare these with nearby candles rather than judging their length in isolation.
The shadows do not need to be exactly equal. The body also does not have to sit precisely at the midpoint. A centred doji with long shadows is often described as a rickshaw man, but that narrower label is not essential to understanding the broader pattern.
An Original Price Example
Suppose a hypothetical share records these prices during one completed session:
| Price measure | Value |
| Open | ₹1,000 |
| High | ₹1,030 |
| Low | ₹970 |
| Close | ₹1,002 |
The total range is ₹60, while the real body is ₹2. The upper shadow is ₹28 and the lower shadow is ₹30. The body is therefore about 3.3% of the total range, with long shadows on both sides.
This is a useful illustration of the shape, not a rule that every valid candle must meet exactly. A ₹60 range could be unusual for one share and routine for another. We still compare it with the instrument’s recent behaviour.
What Happens During its Formation?
The candle tells us that trading occurred substantially above and below the opening area before the period ended near it. Buyers were unable to sustain the highest prices, and sellers were unable to sustain the lowest prices through the close.
However, the candle alone does not reveal the order of those events. Price might have risen first and then fallen, or fallen first and then recovered. Several swings could have occurred within the same session.
That distinction matters. We should avoid describing an exact intraday battle from four price points unless a lower-timeframe chart actually shows it. The same daily candle can contain different paths and different opportunities or risks for an intraday participant.
We also cannot identify who traded from the candle’s shape. A long-legged doji does not prove institutional accumulation, distribution or manipulation. News, changing expectations, low liquidity and ordinary two-sided trading can produce similar-looking outcomes.
Where Does the Candle Matter on a Chart?
Location gives the pattern context. Before focusing on the doji, we look left and ask whether price has been trending, approaching a known level or moving repeatedly between the same boundaries.
After an Uptrend
A long-legged doji after a sustained advance can prompt us to examine whether buying momentum is weakening. This becomes more relevant when the candle overlaps an earlier swing high or another visible resistance area.
It still does not establish a market top. Price may pause and then continue higher. Treating every doji after a rally as a reason to expect a decline confuses a question about momentum with an answered question about direction.
We therefore watch whether subsequent candles hold the upper part of the range, break above it or begin closing below its lower boundary. Those outcomes tell different stories.
After a Downtrend
After a decline, the same shape can suggest that sellers have encountered opposition. If it forms around an earlier reaction low, we can examine whether that support area is holding.
A later close above the doji’s high supports a bullish interpretation of the follow-through. A break below its low points the other way. Neither outcome becomes certain simply because the earlier candle had a small body.
Our discussion of bullish candlestick patterns provides wider context for studying possible shifts in buying pressure without assuming that every reversal pattern succeeds.
Inside a Sideways Range
Within consolidation, a long-legged doji may add little information. If nearby candles already overlap and repeatedly reverse, another two-sided candle may reflect the existing conditions.
The range boundaries can be more useful than the candle’s name. We can ask whether price is testing the top or bottom of that range, or simply fluctuating in its middle.
How Do We Assess Confirmation?
Confirmation means defining which price action would support our interpretation. It does not remove uncertainty.
Watch the High And Low
One possible rule is to wait for a completed candle to close beyond the doji’s range. A close above its high supports upward follow-through; a close below its low supports downward follow-through. A brief wick outside the range does not meet a close-based rule.
Check Nearby Price Structure
We compare the breakout with earlier swing points and support or resistance. If confirmation leaves little room before the next obstacle, the potential reward may be small relative to the planned risk. Support and resistance can also fail.
Use Volume Carefully
Where meaningful traded volume is available, we compare similar periods, allowing for intraday differences. Higher volume shows greater activity but does not guarantee follow-through.
A spot index is calculated rather than traded directly. If we use futures volume for context, we keep clear which instrument it belongs to.
Add Indicators Only When They Answer a Question
Moving averages and momentum indicators can add context. However, several indicators based on the same prices may repeat information rather than provide independent confirmation.
Bullish and Bearish Examples: How the Analysis Changes
These hypothetical scenarios illustrate how we can organise an assessment. They are not trading recommendations.
A Possible Bullish Scenario After a Decline
Suppose a share falls towards support around ₹970 and forms our example candle: open ₹1,000, high ₹1,030, low ₹970 and close ₹1,002.
A later close at ₹1,036 meets a rule requiring a close above the doji high. We then assess whether nearby resistance leaves enough room relative to the planned risk. If price closes below ₹970 before upward confirmation, the bullish idea lacks the evidence we were waiting for.
A Possible Bearish Scenario After a Rally
Suppose another share rallies towards resistance, then opens at ₹1,500, reaches ₹1,545, falls to ₹1,455 and closes at ₹1,498. Its ₹2 body sits within a ₹90 range.
A subsequent close at ₹1,448 meets a rule requiring a close below the doji low. We still assess nearby support, the invalidation level and trading constraints. The pattern does not establish that a particular short-selling or derivatives route is available or suitable. A move above the doji high challenges the bearish interpretation.
When the Breakout Fails
If price breaks out and returns inside the range, we evaluate the weakening follow-through against our pre-defined exit or invalidation rule. Moving that level repeatedly changes the planned risk. Sometimes the assessment produces no suitable trade.
How Do We Think About Stop-Losses and Position Size?
We start with the point at which our interpretation would no longer make sense. The opposite side of the doji can be one reference, but it is not a universal stop-loss rule. A wide candle may require a larger distance; moving the stop closer simply to improve the numbers changes the setup.
For a hypothetical unleveraged share position, an entry at ₹1,036 and stop at ₹968 give planned price risk of ₹68 per share. A ₹1,360 risk budget therefore gives 20 shares before costs or execution differences. This illustrates the calculation, not suitability:
Illustrative quantity = hypothetical risk budget ÷ planned risk per share.
A target of ₹1,172 offers ₹136 of potential price gain against ₹68 of planned risk: a 2:1 reward-to-risk ratio before costs. It does not indicate the probability of success.
Gaps, slippage and charges can increase realised loss, and a stop order does not guarantee the chosen exit price. Options and futures require separate assessment of contracts, lot sizes, leverage and pricing; this share calculation does not transfer directly.
Which Timeframe Should We Use?
A long-legged doji can form on intraday, daily or weekly charts. The timeframe determines the period being summarised, so we first choose one that matches the question we are studying.
A five-minute candle describes a short interval. A daily candle covers a session, and a weekly candle covers a broader period. None deserves a universal reliability ranking without a defined test on the relevant market.
For intraday analysis, we can compare the candle with the session’s opening range, recent swings and the broader trend. A short-term bullish break may still face resistance visible on a higher timeframe.
Switching timeframes after a setup starts failing can blur the original decision. We can use multiple timeframes for context, but the trigger and invalidation rules should remain clear.
Liquidity matters across timeframes. Sparse trading or wide spreads can produce unusual candles and make displayed prices difficult to execute. We should distinguish an interesting chart shape from a practical trading opportunity.
How Does it Differ From Similar Candles?
Several candles indicate uncertainty, but their structures differ. We can compare the body and shadows before assigning meaning to the name.
| Candle | Body and shadows | What we examine next |
| Long-legged doji | Almost equal open and close; long shadows on both sides | Trend, location and follow-through beyond the range |
| Standard doji | Almost equal open and close; shadows can be less extended | Whether the pause matters in its chart context |
| Dragonfly doji | Open and close near the high; long lower shadow | Whether later price action supports the lower-price rejection |
| Gravestone doji | Open and close near the low; long upper shadow | Whether later price action supports the higher-price rejection |
| Spinning top | Small but more visible body; shadows on both sides | Whether indecision develops into a directional move |
| Rickshaw man | Doji body close to the middle of long shadows | The same contextual checks, with more symmetrical structure |
The dragonfly doji deserves particular attention because its long lower shadow can make it look similar at a glance. The difference is that the long-legged doji has extended shadows on both sides.
A hammer also has a small body and a long lower shadow, but its body need not meet a doji definition. We avoid merging these labels merely because the lower wick is prominent.
A doji can also appear within a larger multi-candle pattern. In that case, we need to assess the complete formation, including the surrounding candles. One long-legged doji cannot stand in for all the requirements of a morning star, evening star or harami cross.
Can We Scan for the Pattern and Test its Usefulness?
We can scan for a small real body and long upper and lower shadows, but definitions vary between tools. We check the scanner’s rules and sample matches rather than assuming that every result fits the visual pattern.
Recognition alone does not establish a useful trading strategy. Testing also requires defined confirmation, entry, invalidation, exit and cost assumptions. We assess losses, drawdowns and average outcomes alongside win rate, and evaluate rules on unseen data rather than repeatedly fitting historical results.
There is no universal long-legged doji win rate. Results depend on the definition, instrument, timeframe and complete trading rules. This guide does not present an original backtest or claim that confirmation guarantees an edge.
What Changes When We Analyse Options?
A long-legged doji on an underlying share or index does not tell us which option to select or whether a position will make money. Premiums also depend on strike, time to expiry and implied volatility. An option can lose value despite a favourable move in the underlying.
Before a scheduled event, we also consider how much movement premiums already reflect. The candle alone cannot answer that question.
Open interest records outstanding contracts; a large figure at one strike does not make it certain support or resistance. Liquidity and bid–ask spreads also affect entry, exit and risk.
A doji on an option-premium chart needs separate interpretation because it can reflect the underlying, volatility, time value or trading activity.
How We Can Use Nubra’s Tools to Organise the Analysis
Once we have answered the chart question, we can separate the remaining tasks: reviewing price structure, examining contracts and assessing payoff assumptions.
With Nubra Charts, we can review the underlying chart and locate the candle within the broader price move. Our starting points are the completed candle, its high and low, and nearby support or resistance.
For options context, Nubra Option Chain provides a place to examine contracts and open interest. We keep that information distinct from the chart signal: contract data adds context, but it does not confirm a future price direction.
The Nubra Strategy Builder supports reviewing options payoff scenarios. We can examine how a proposed combination’s payoff depends on its assumptions rather than treating a directional view as a complete strategy.
Charts and Strategy Builder may require sign-in. These tools support analysis; they do not guarantee execution prices, predict the next move or remove trading risk.
Our aim is a consistent sequence: understand the candle, assess the follow-through, calculate the risk and then examine the relevant instrument. Each step answers a different question, and none makes the others unnecessary.
FAQs
Is a Long-Legged Doji Bullish or Bearish?
The candle itself is neutral. We assess a bullish or bearish interpretation through its location and subsequent price action. Its colour alone does not determine the direction of the next move.
Does a Long-Legged Doji Guarantee a Reversal?
No. It can appear before a reversal, continuation or further consolidation. We treat it as a reason to examine the chart more closely, rather than proof that the existing trend has ended.
Do Both Shadows Have to be Exactly the Same Length?
No. Both should be long for the usual visual interpretation, but perfect symmetry is unnecessary. A body near the midpoint with long shadows is often called a rickshaw man. Software definitions can differ.
How is it Different From a Spinning Top?
A spinning top has a small but more visible body. A doji has an open and close that are equal or nearly equal. Both can reflect uncertainty, so we still need context and follow-through.
Can We Use it for Intraday Analysis?
Yes, but we need a completed candle, a defined timeframe and realistic execution assumptions. Short intervals can contain substantial noise. Liquidity, spreads and the broader session structure deserve attention alongside the candle.
Can We Select an Options Strategy From this Candle Alone?
No. The candle describes price behaviour, while an options assessment also involves premium, strike, expiry, volatility, liquidity and risk. We need to examine those factors separately before considering any strategy.
Disclaimer: The information provided in this blog is for educational and informational purposes only and should not be construed as investment advice, financial advice, or a recommendation to buy, sell, or hold any securities or financial products. Investments in the securities market are subject to market risks. Please read all related documents carefully before investing. Readers should conduct their own research and consult a SEBI-registered investment adviser or other qualified financial professional before making any investment decisions. Past performance is not indicative of future results.